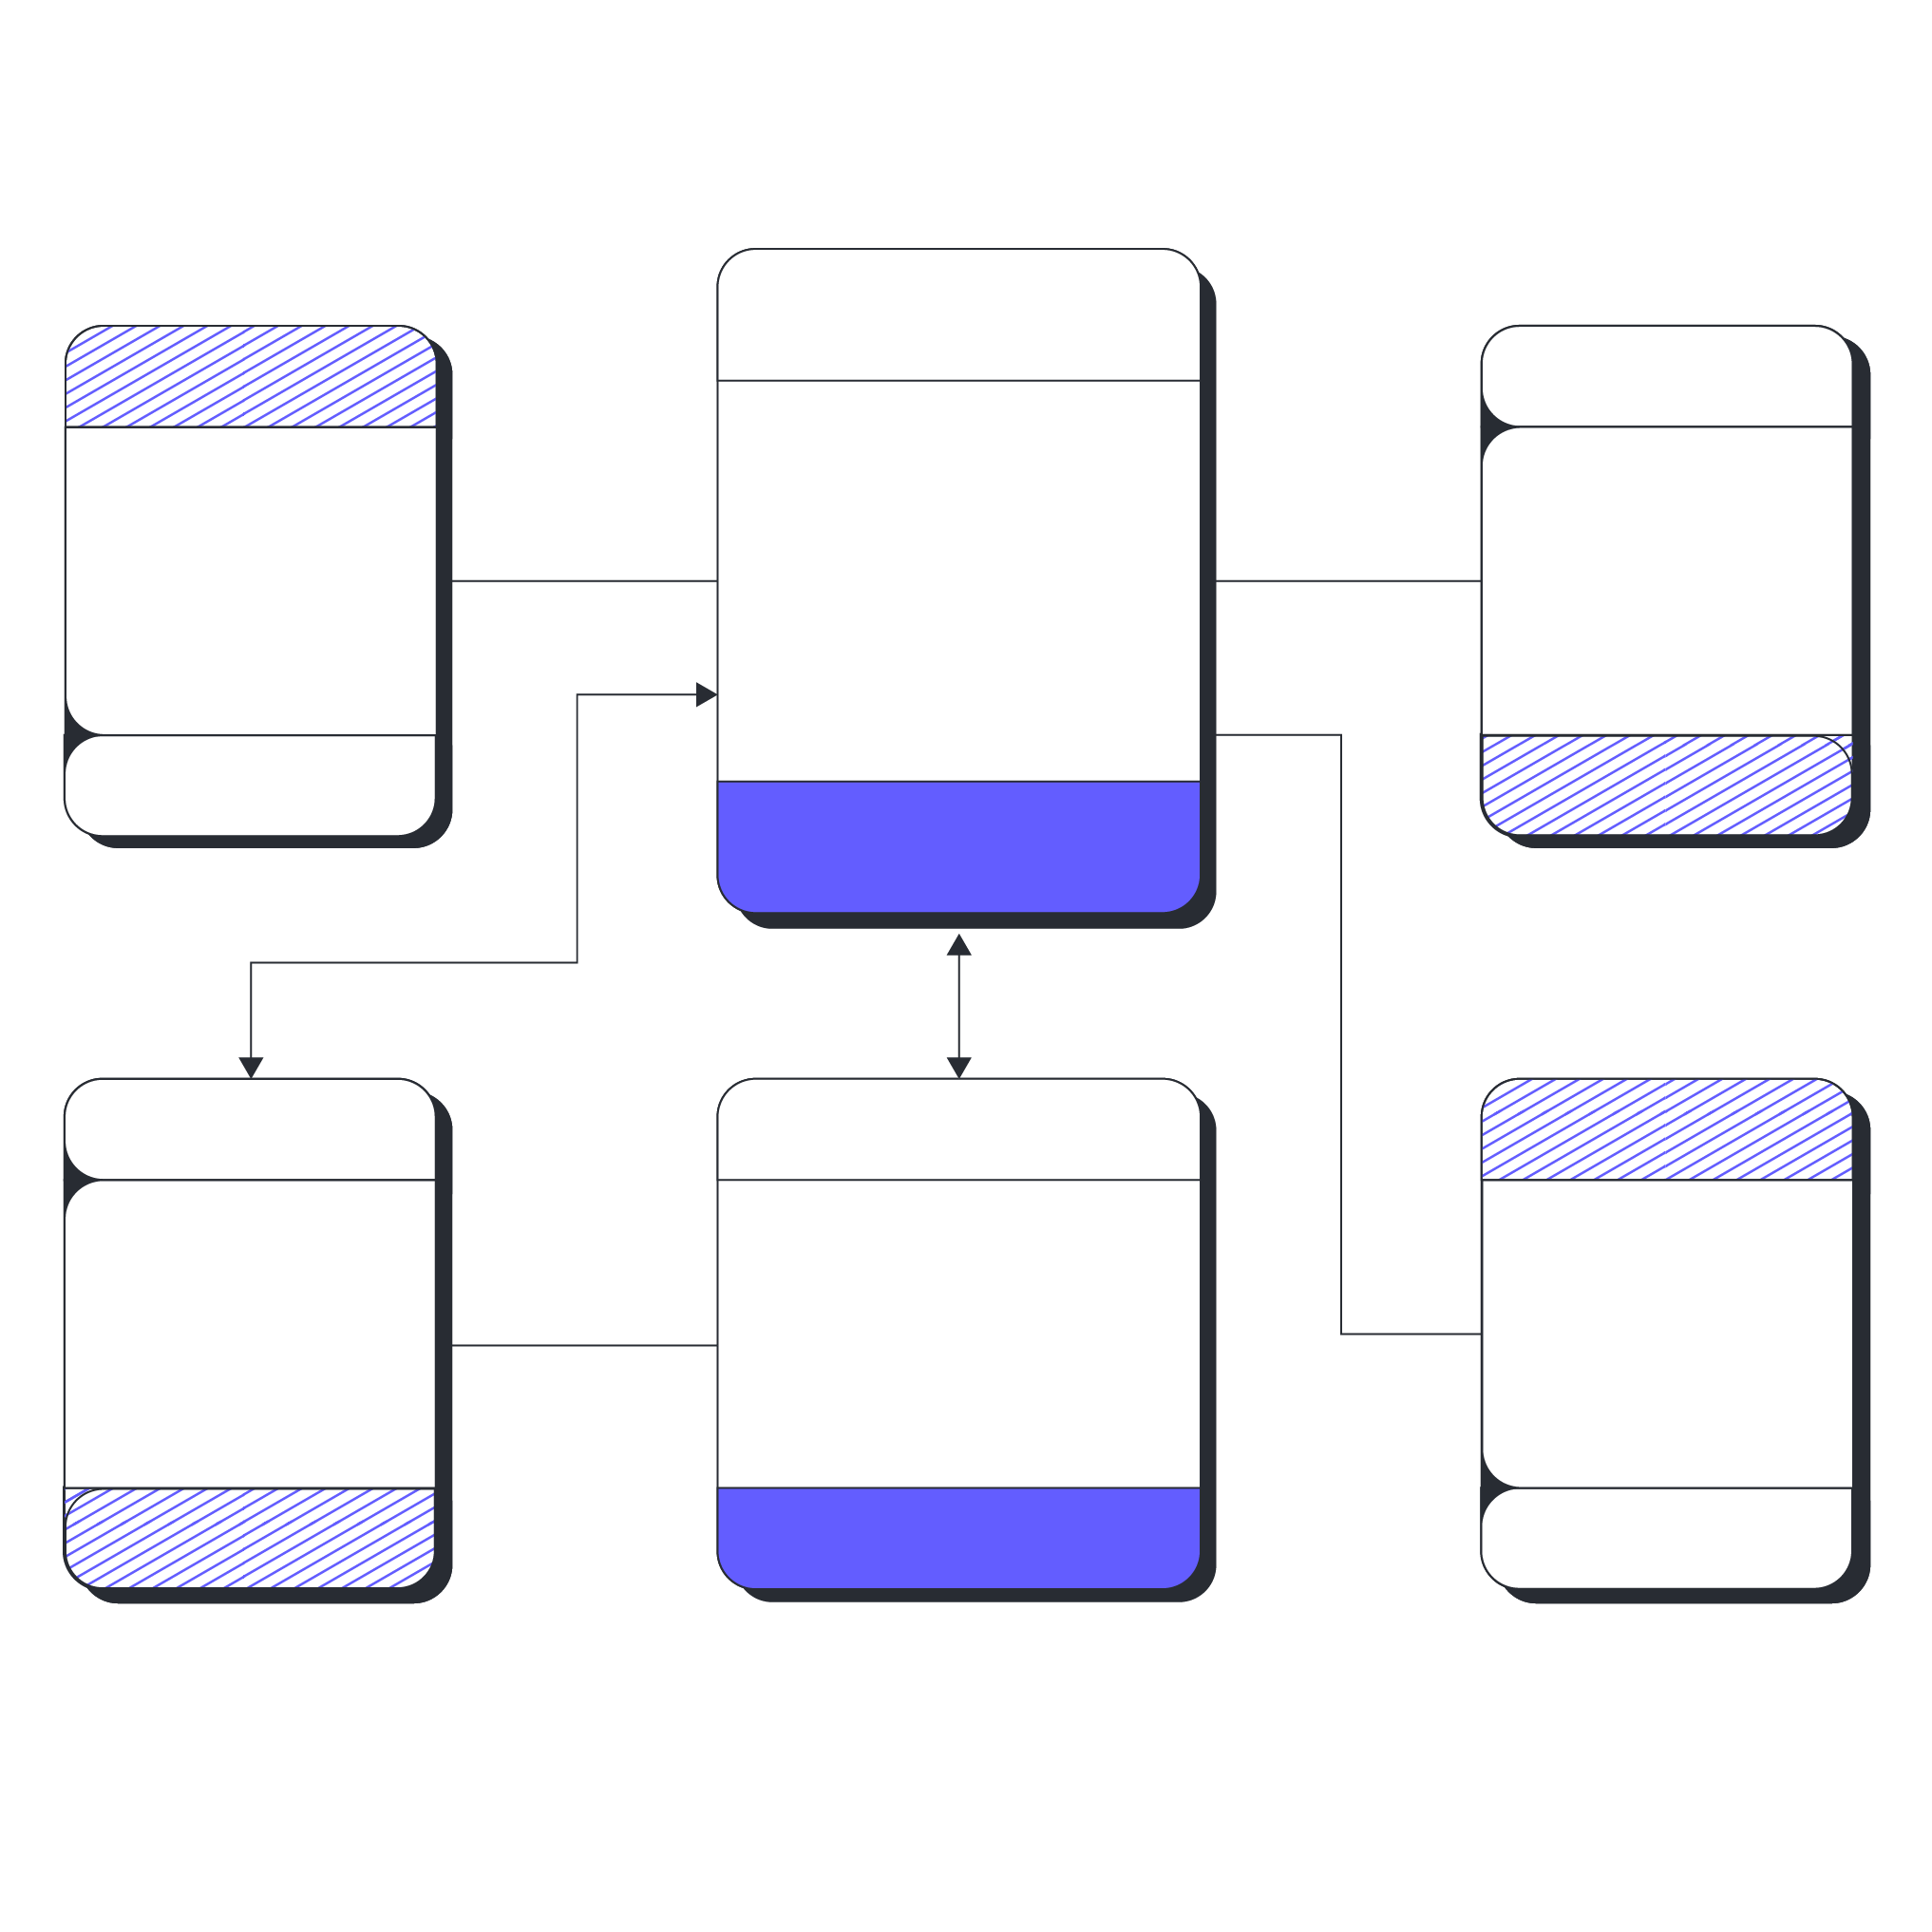
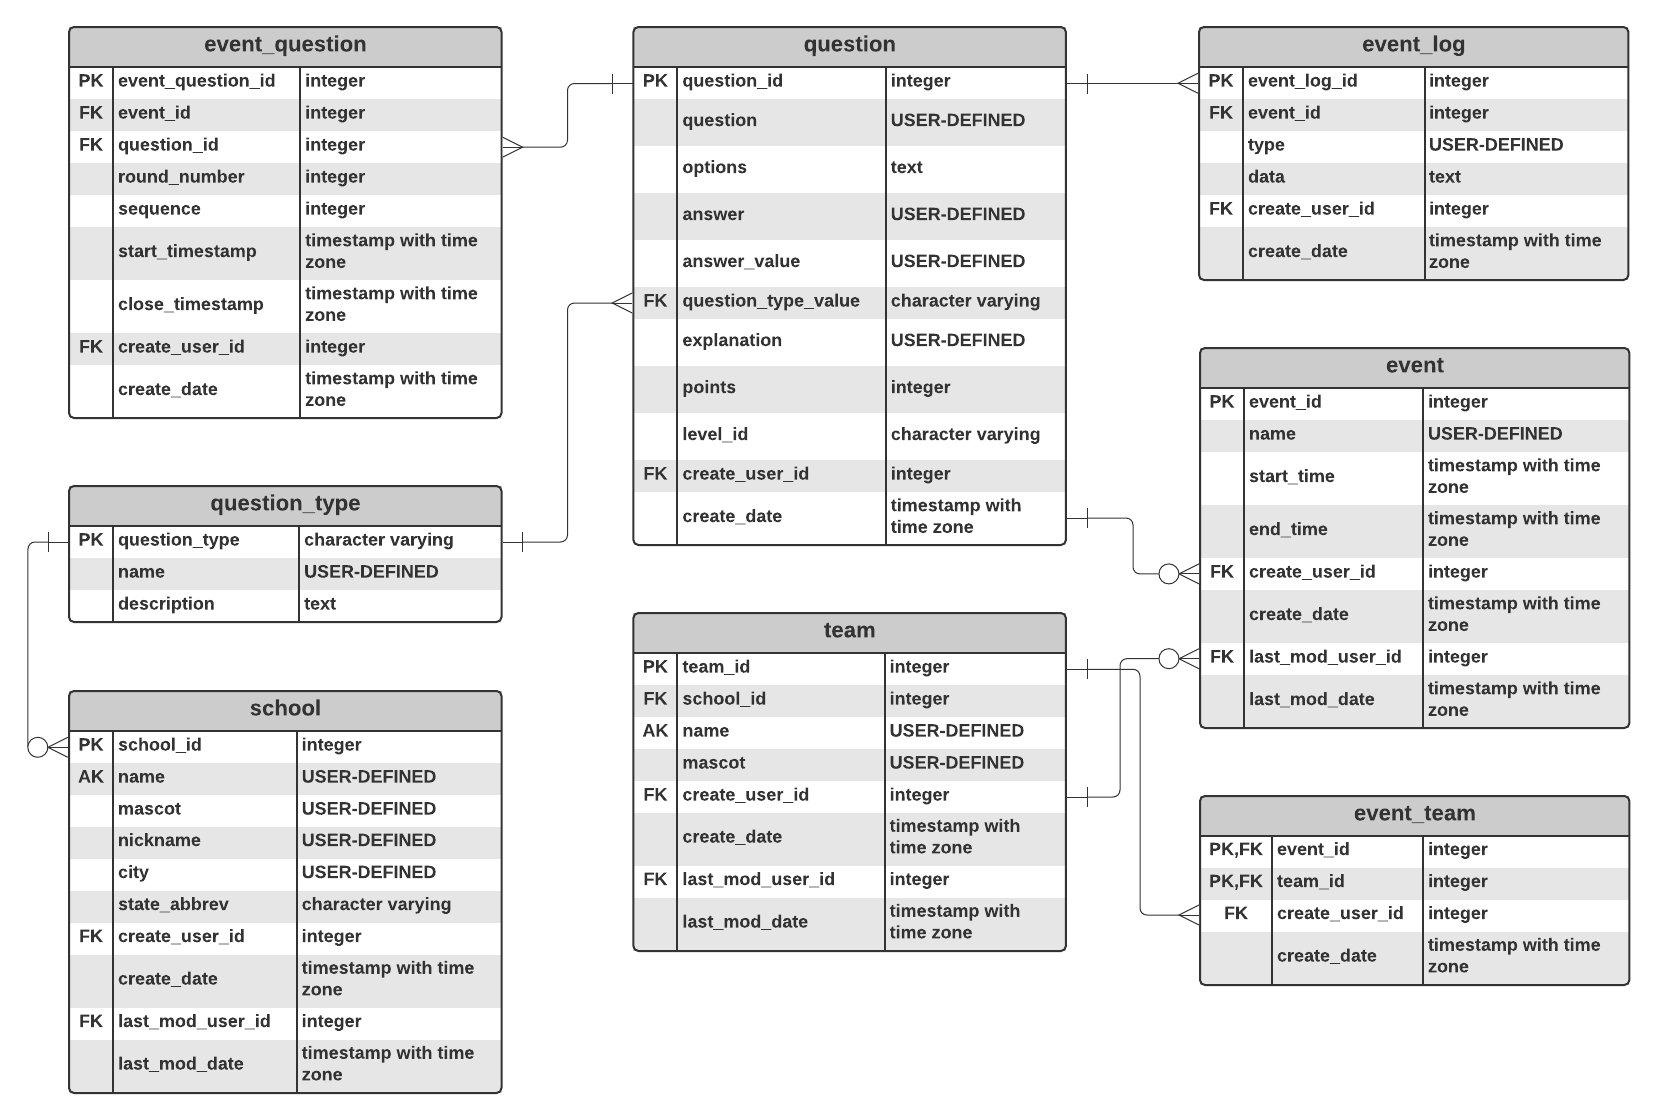
release software in Lucidchart

How to release software quickly in Lucidchart

Lucid Content

Reading time: about 5 min

Topics:

  • IT and Engineering
  • Lucidchart tips
  • Product development

The process of developing, testing, releasing, and managing software requires more agile and airtight management than ever before—so much so, that software management has become its own discipline. 

Software engineering requires all hands on deck, with precise planning, cooperation, and communication from engineers, developers, UX teams, and beyond. Rather than spread your collaborative efforts across programs that will leave you lost in translation, we suggest trusting your release cycle to the only intelligent diagramming platform that will take you from the beginning stages of ideation all the way to software support.

Plan your software release

A productive, streamlined software release cycle begins with effective planning. You may find that your planning stage is the most time-intensive, as it involves the breakdown of your entire release structure from start to finish. The more detailed your Agile release plan, the better you’ll be able to keep your team on track and enforce various standards and requirements throughout the development and release cycle.

product roadmap example
Product roadmap example (Click on image to modify online)

Lucidchart can help you provide your team with a larger picture of your release, as well as the nitty-gritty details like sprint planning and individual task ownership. Easily create detailed timelines, Gantt charts, Scrum boards, or Kanban boards to contextualize important tasks, delivery dates, requirements, and goals within different stages of release and simplify the handoff from team to team. 

Detailed Scrum Task Board Example
Detailed Scrum board example (Click on image to modify online)

Visualize your systems in one easy-to-access location

Once you have planned out your software release, you can also use Lucidchart to visualize and clarify what needs to be built. Consider the following diagrams to document your systems and software designs.

UML activity diagram

A UML activity diagram can serve to demonstrate how your system is being modeled and clarify complicated use cases. It’s ideal for software developers and program managers who would like to more easily illustrate relationships between software applications and connections. 

UML class diagram example
UML class diagram for ATM example (Click on image to modify online)

Use swimlanes within your UML diagram to better visualize who will be working on each piece of the project at a given time and what dependencies exist in your software release cycle. 

There are 13 types of UML diagrams. Find the one that's best for your project.

Learn more

Entity-relationship diagram (ERD)

ER diagrams are typically used as part of the initial step of determining the various requirements for an information systems project. An ER diagram can also be useful in visualizing, conceptualizing, and designing relational databases in terms of logic and key business rules. 

Save valuable time by generating an entire ER diagram in Lucidchart using your existing database structure. Flesh out your ER diagram with dedicated ER diagram shape libraries and include tables or other fields to provide your team with additional context. 

ERD import example
Entity-relationship diagram example (Click on image to modify online)

Data flow diagram

Use a data flow diagram to analyze and construct any and all relevant information processes for your release. Also referred to as a process model, your data flow diagram can clearly illustrate the flow of information based on inputs and outputs. 

With Lucidchart’s well-stocked data flow diagram shape libraries and various formatting tools, you can create basic, complex, and multi-layered data flow diagrams that your entire team can access for clarification and direction.

data flow diagram level 1
Data flow diagram: Level 1 (Click on image to modify online)

Low- and high-fidelity mockups

Make your ideas more tangible with a wireframe sketch of your ideas, complete with more visual UI details that provide your team with a realistic view of your final product. Your mockups can provide stakeholders with a chance to view, analyze, and offer constructive criticism on your design before committing to anything final. 

low-fidelity mockup example
Low-fidelity mockup example (Click on image to modify online)

Build low-fidelity mockups in Lucidchart to guide your brainstorming processes and avoid costly or complicated revisions. You can create interactive high-fidelity mockups in minutes that give designers, developers, and other key stakeholders a complete visualization of your product’s design and behaviors. 

See all the ways that Lucidchart can help UX designers better understand users and save time by mapping out designs at a lower fidelity.

Learn more

Program flowchart

A program flowchart can be particularly useful for programmers and software designers to illustrate models and maps related to your software process. Easily map out the sequence of instructions in your program using customized symbols, graphics, and commands that provide your team with customized program documentation for more efficient communication and problem-solving.

Collaborate across teams to stay aligned throughout your development cycle

Frequent communication and collaboration remain crucial throughout the software release cycle. With open and active communication, you can ensure transparency as well as agile development and troubleshooting. The more efficient your communication across teams, the shorter and more effective you’ll see your development cycle become.

Lucidchart’s collaborative features facilitate seamless communication between teams and individuals. 

Give your team permission to access your visuals to align stakeholders on your vision or gain valuable feedback before finalizing decisions. Lucidchart updates comments and edits in real time, so you can view and take action on feedback with virtually no lag time. For even more immediate attention, tag collaborators with @mention comments to draw focus where it’s needed within your diagram.

remote collaboration in sprint planning

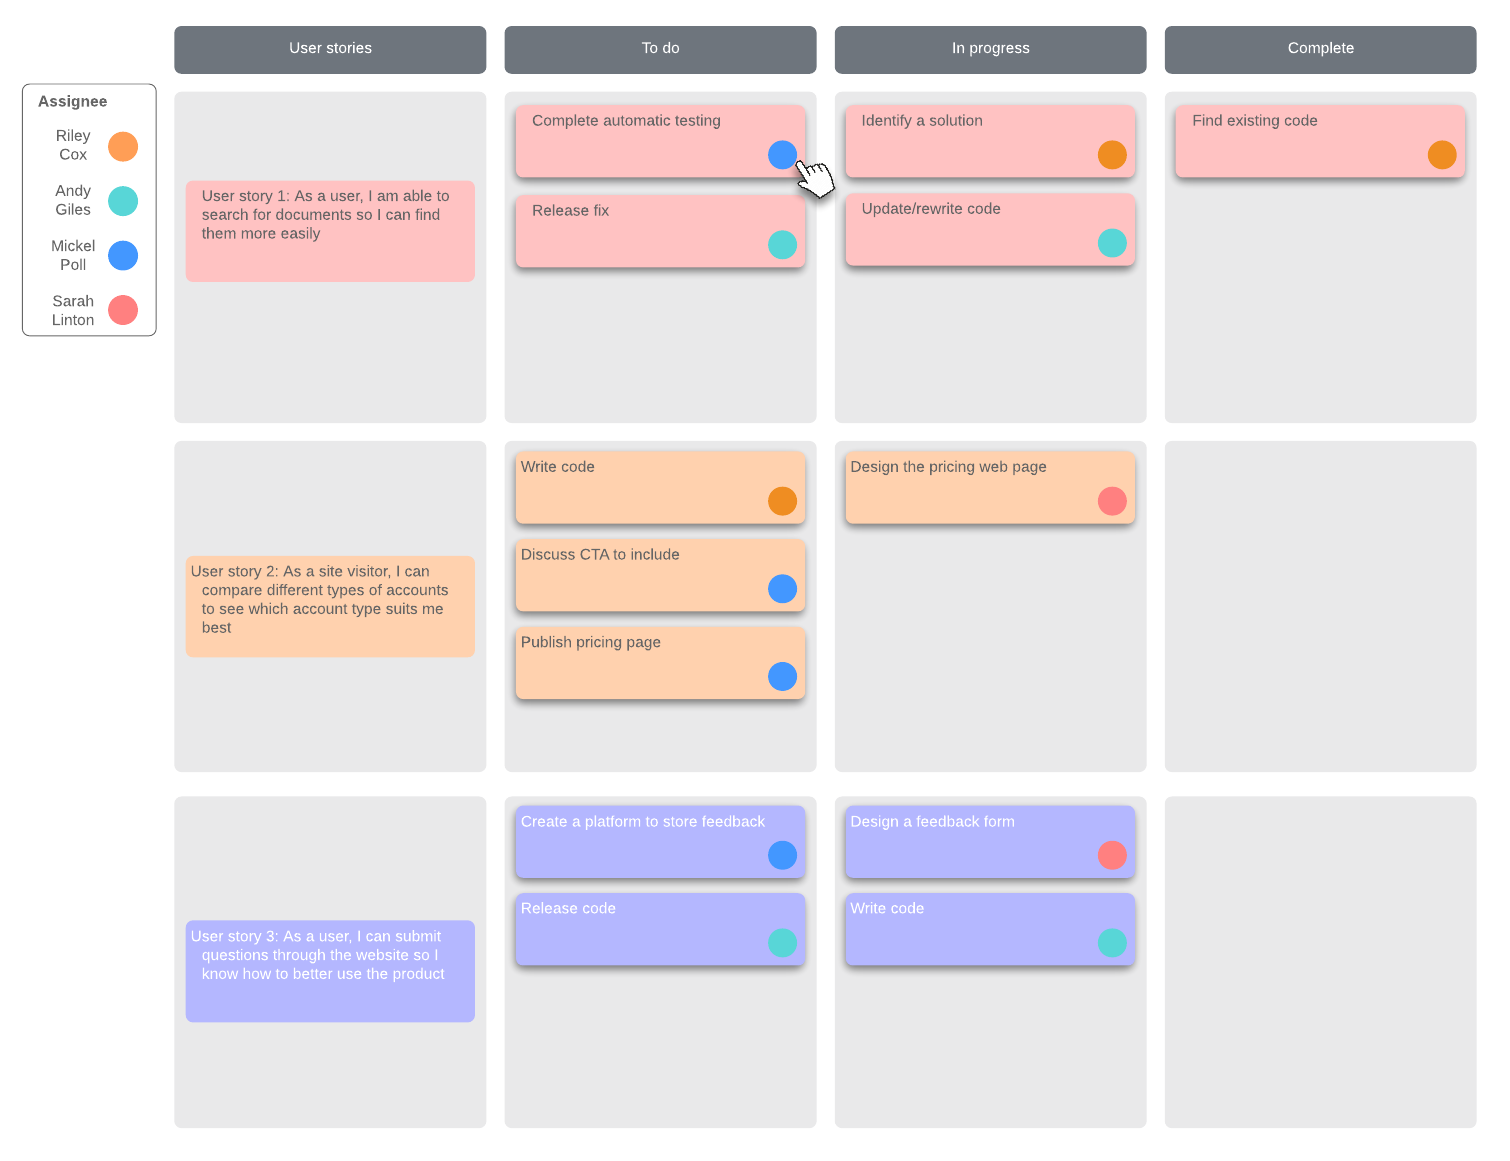
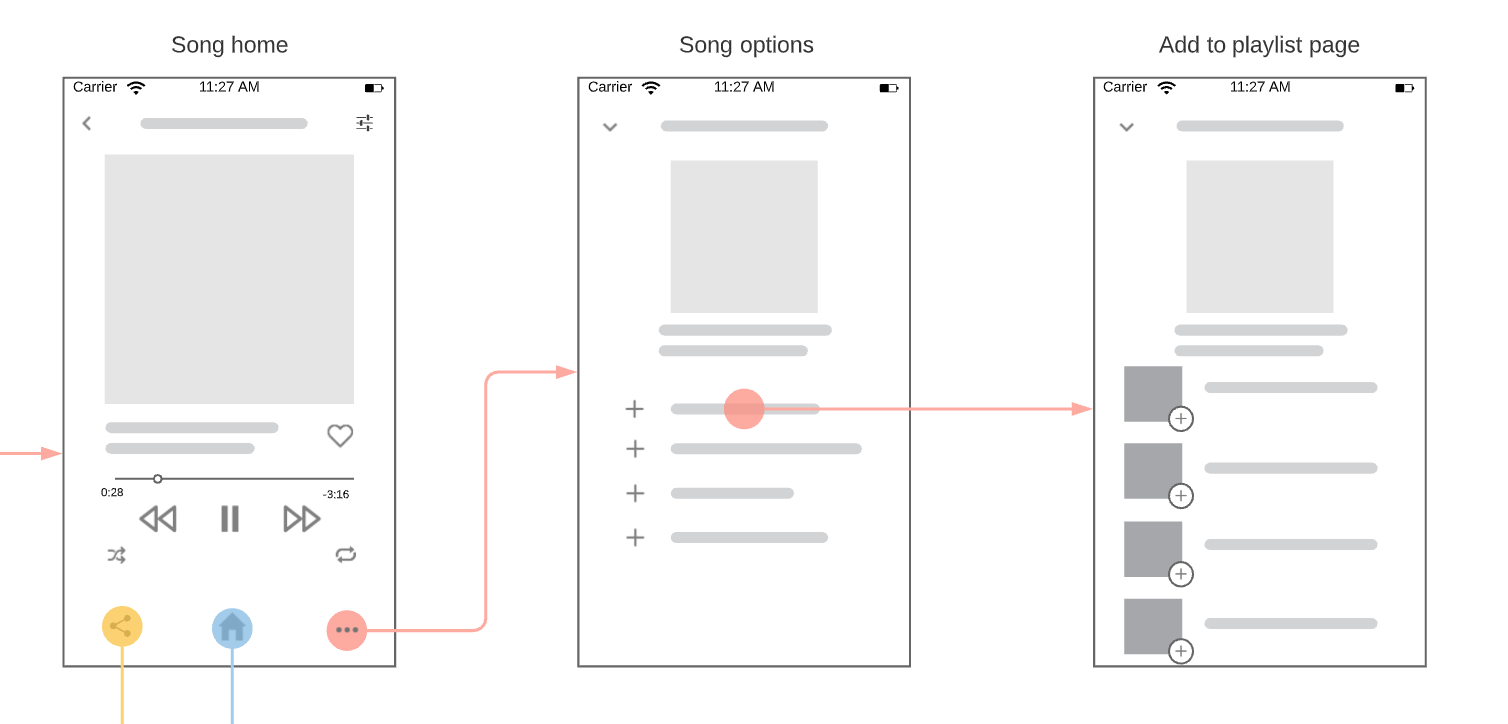
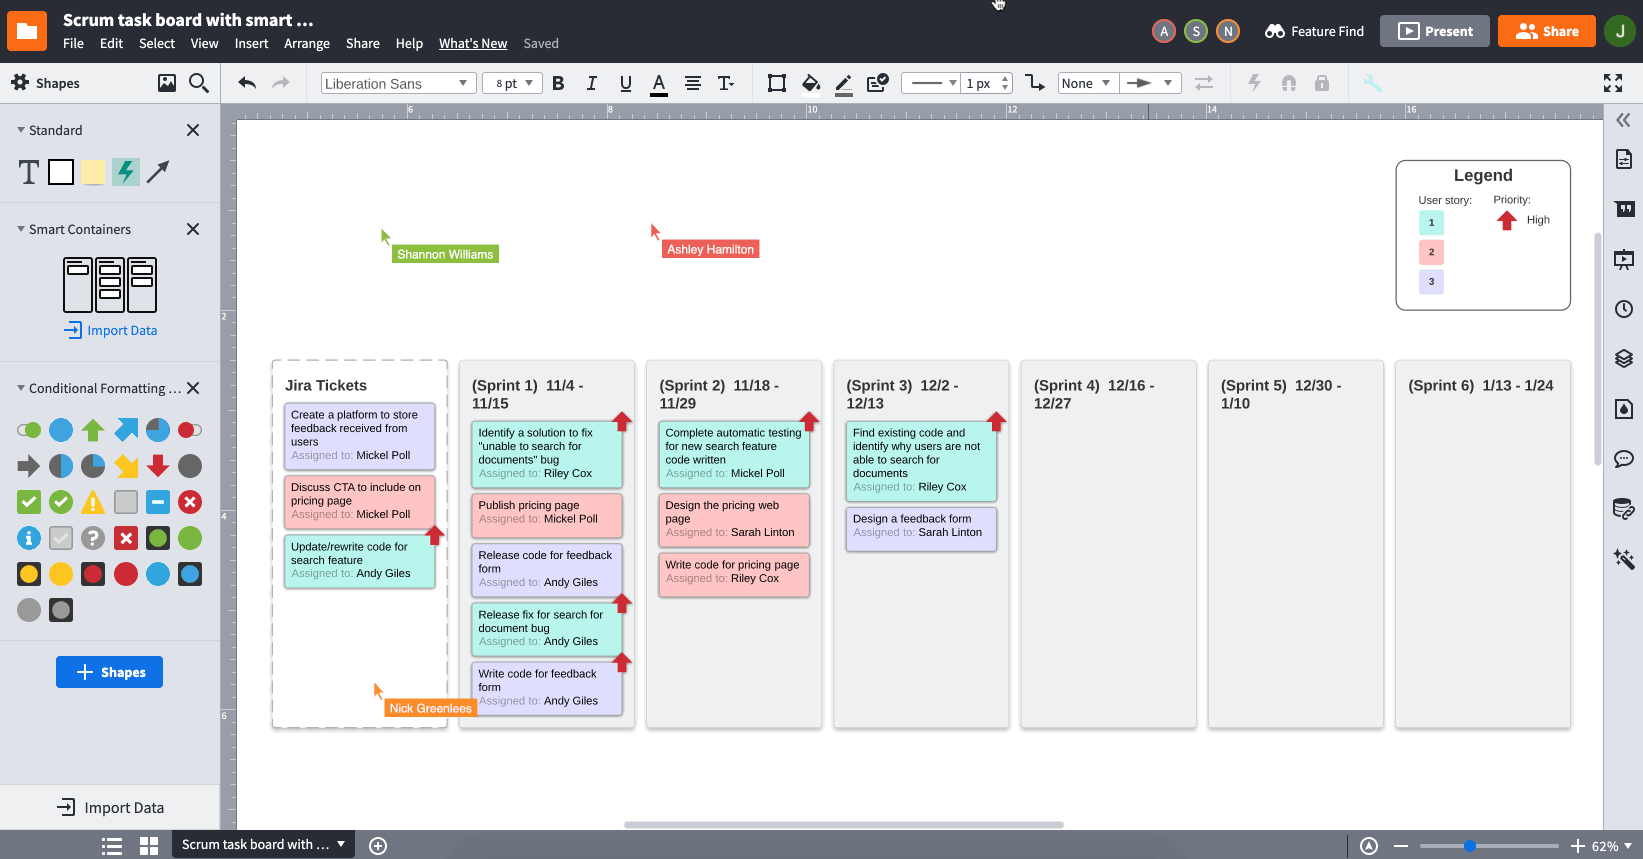
Track results from user testing

One of the most crucial points in the software release cycle, user testing should be carefully documented to ensure that data collected from users is efficiently and accurately implemented within each iteration of your product. 

Once your user testing has been completed, Lucidchart can help you track, document, and share your findings. Rather than document results in a one-off document or spreadsheet, you can incorporate user testing results into your relevant diagrams. Create links to issues that arise directly within your documents as an easy reference for product owners, developers, and engineers as they take next steps.

Lucidchart not only keeps you user testing feedback in a centralized location, but it also keeps your results impeccably organized according to your team’s needs. Using swimlanes, customizable charts, and standard Lucidchart shortcuts, you can make it clear what the issue is, what needs to be done, and who is responsible for the fix.

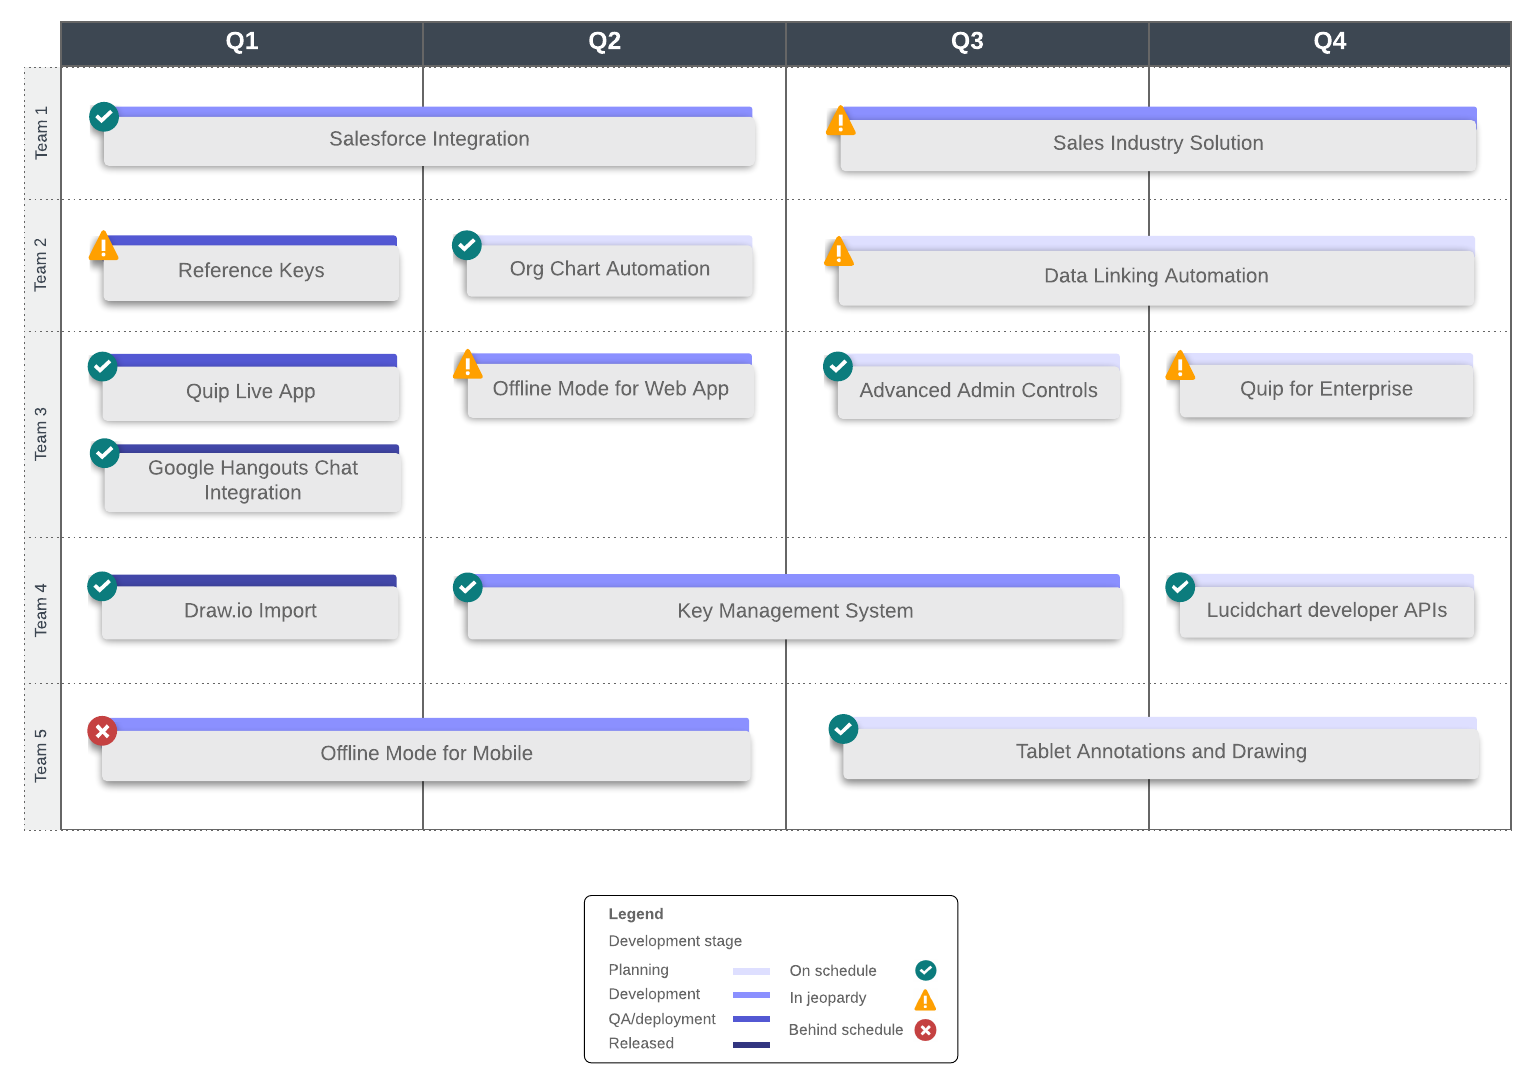
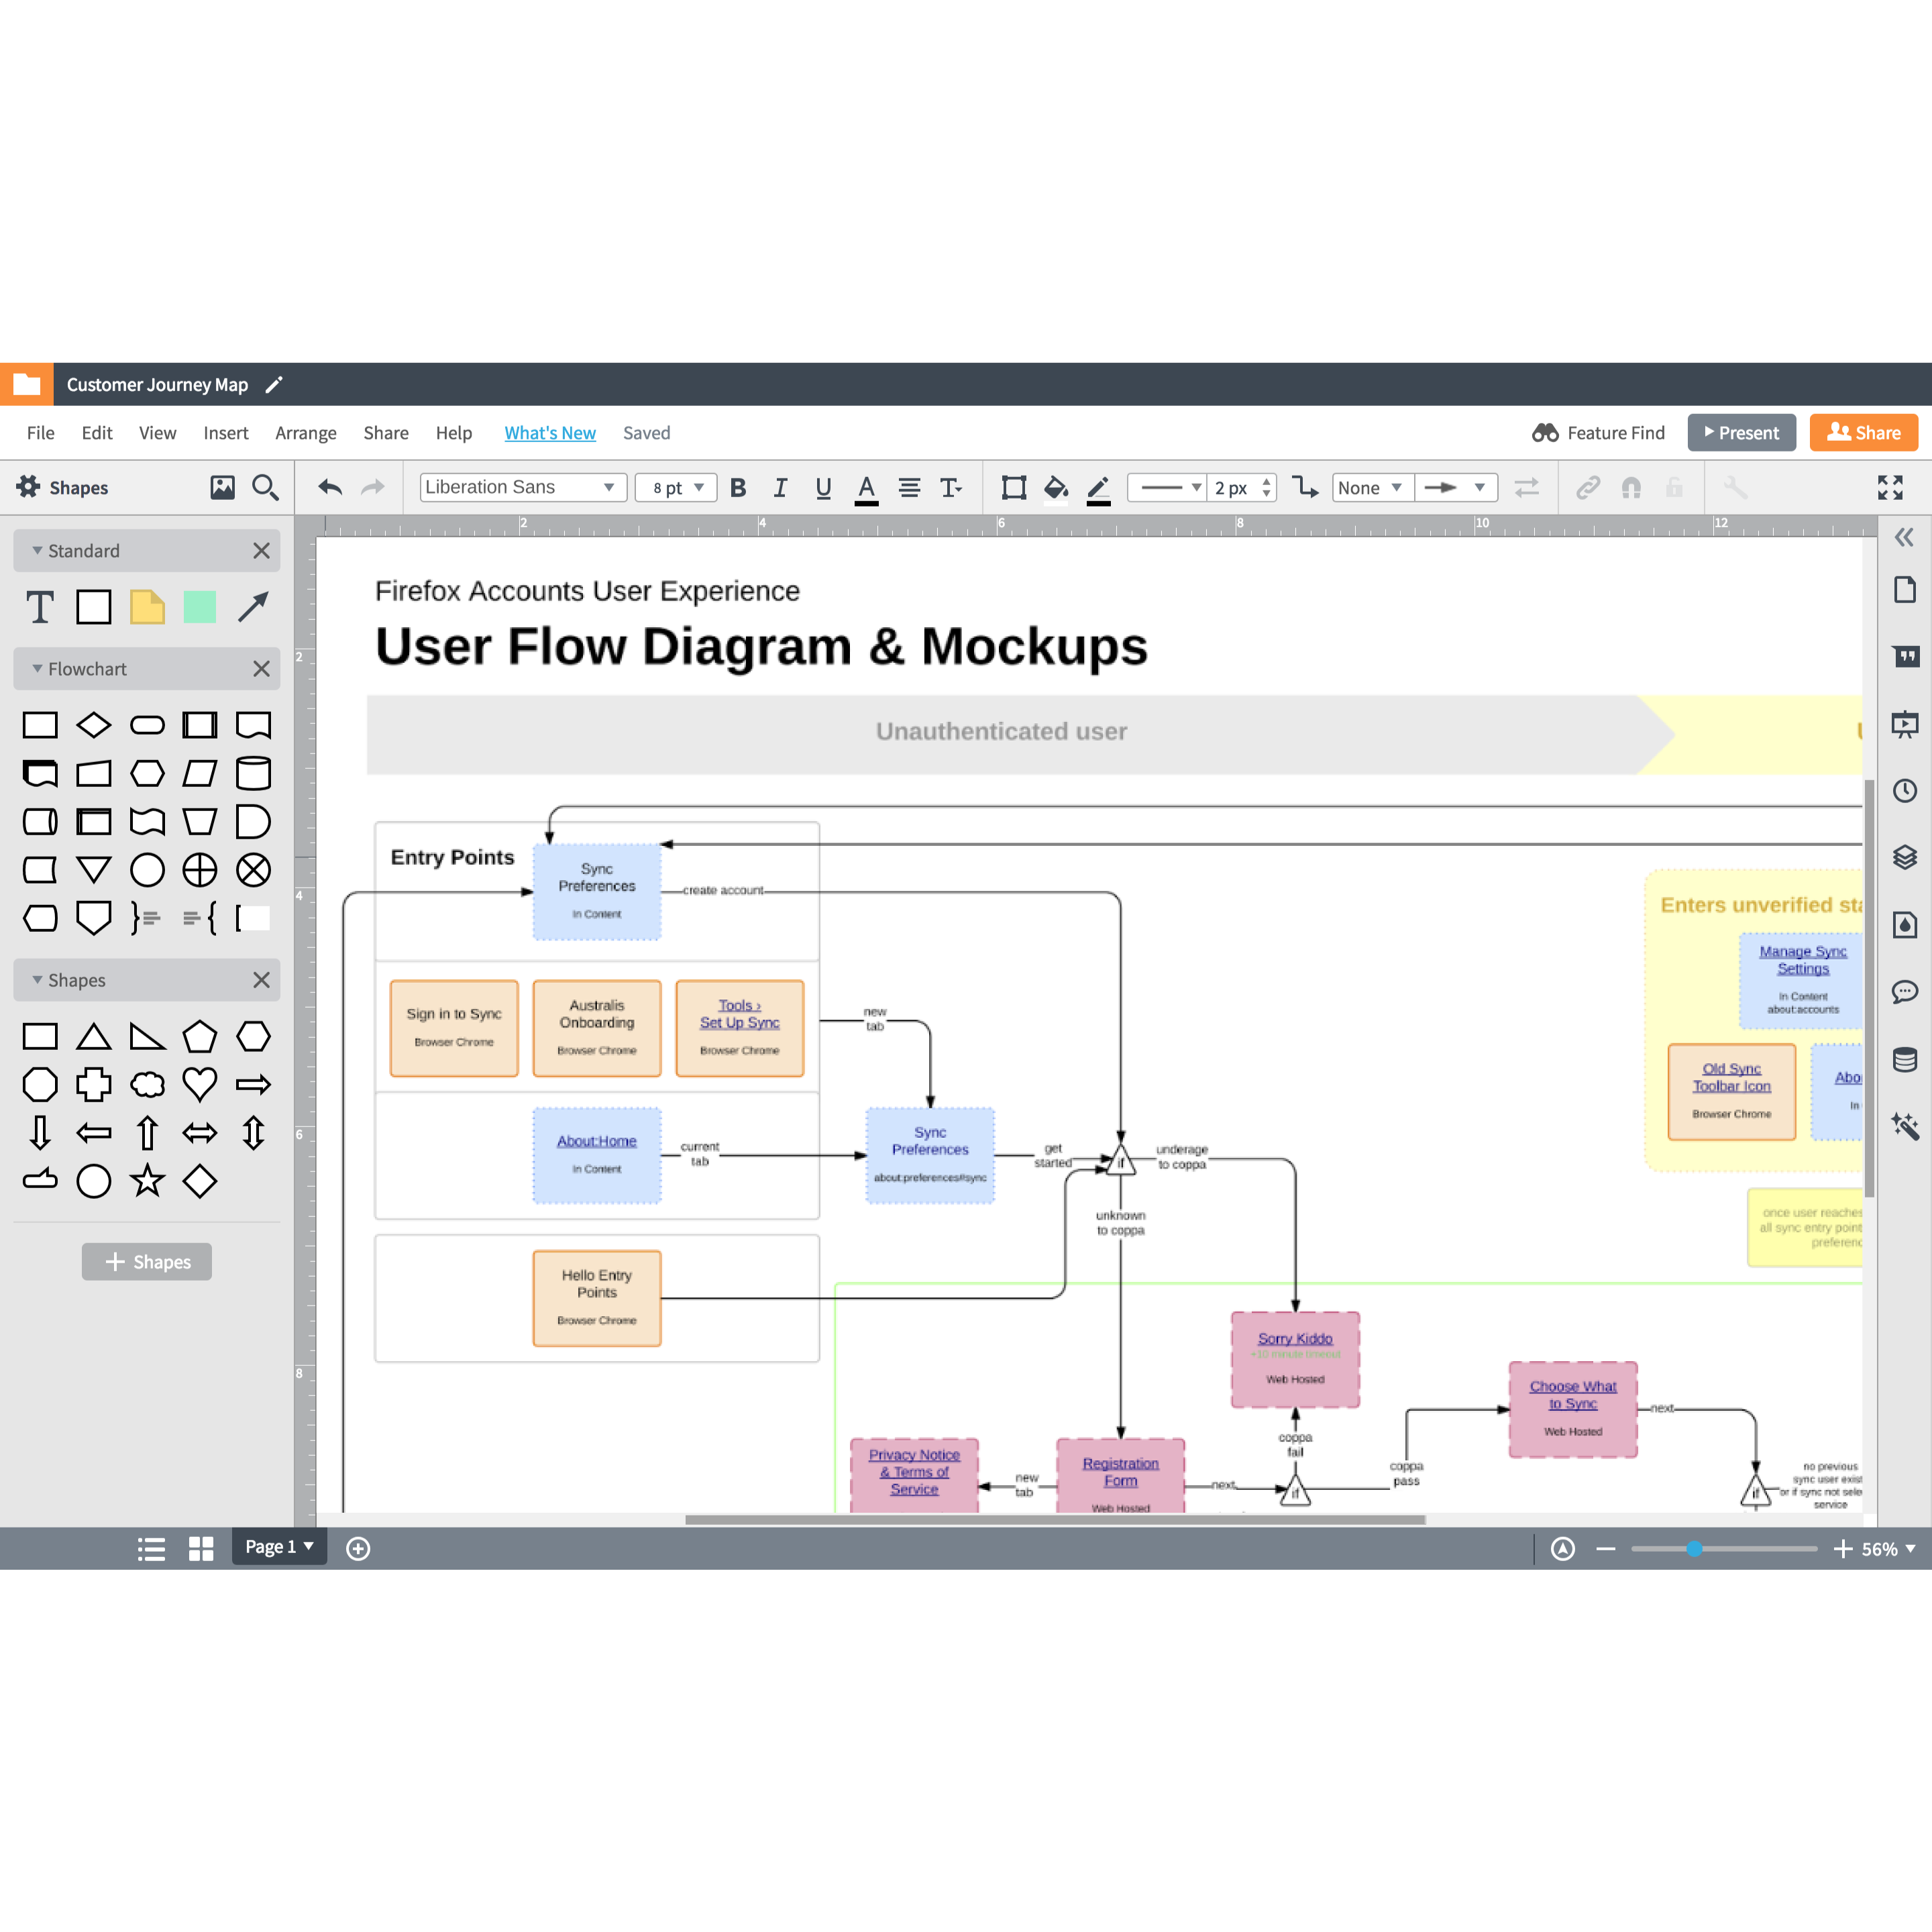
Implement a continuous deployment process model

Today’s software development and release landscape requires faster development, higher quality products, and more frequent and agile responses to customer demands. A continuous deployment process model provides your team with the visibility and agility necessary to stay on top of user demands. 

The ability to visualize, communicate, and track progress on your goals is key to a successful implementation of the continuous deployment process model. Lucidchart is uniquely qualified to support each phase of your project, regardless of project size or scale. 

You've seen the many ways that Lucidchart can help you release software faster. Now get in and start working visually.

Sign up now

Lucidchart

Lucidchart, a cloud-based intelligent diagramming application, is a core component of Lucid Software's Visual Collaboration Suite. This intuitive, cloud-based solution empowers teams to collaborate in real-time to build flowcharts, mockups, UML diagrams, customer journey maps, and more. Lucidchart propels teams forward to build the future faster. Lucid is proud to serve top businesses around the world, including customers such as Google, GE, and NBC Universal, and 99% of the Fortune 500. Lucid partners with industry leaders, including Google, Atlassian, and Microsoft. Since its founding, Lucid has received numerous awards for its products, business, and workplace culture. For more information, visit lucidchart.com.

Bring your bright ideas to life.

Sign up free

or continue with

Sign in with GoogleSign inSign in with MicrosoftSign inSign in with SlackSign in

Get started

  • Pricing
  • Individual
  • Team
  • Enterprise
  • Contact sales
PrivacyLegal

© 2024 Lucid Software Inc.