As a back-end engineer, you need strong programming skills—and you also need to be well organized, able to multitask, good at managing your time, and an excellent communicator. In this article, we’ll introduce you to templates that can help you visualize designs, be more organized, and clearly communicate ideas to stakeholders.
API flowchart
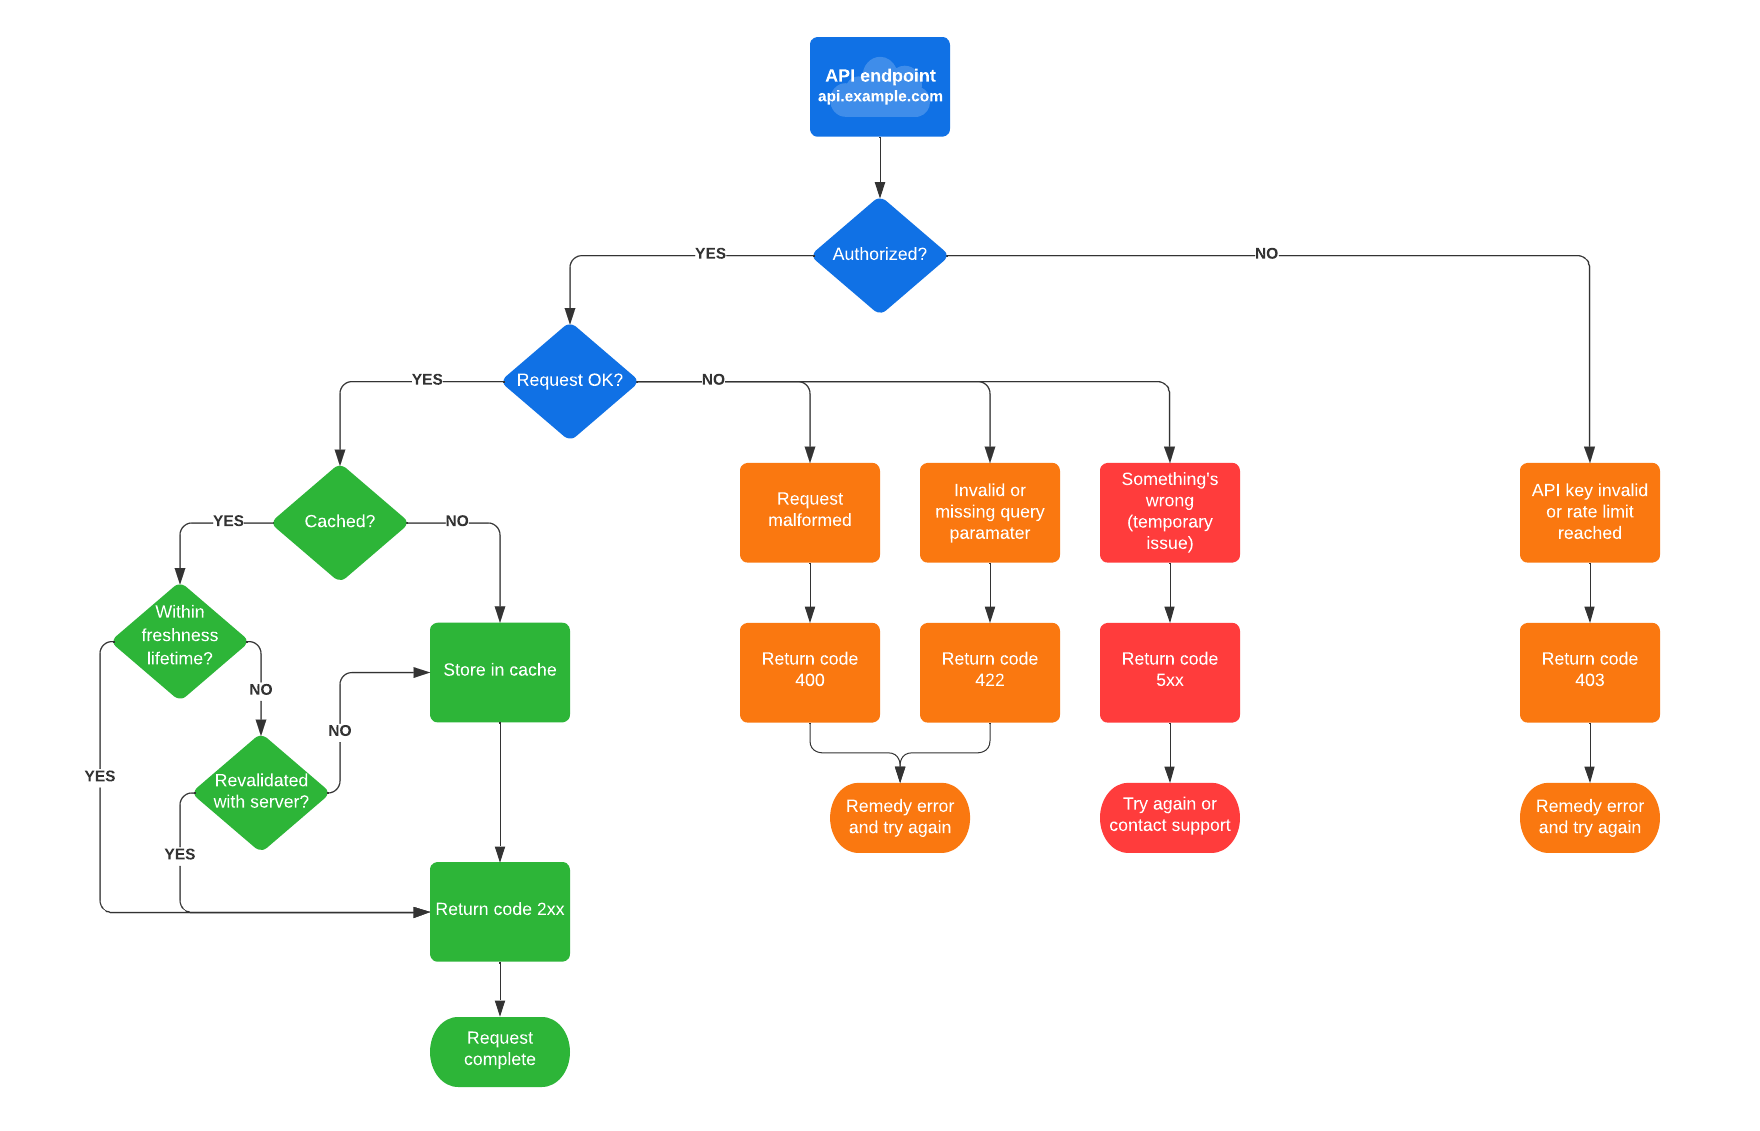
An API flowchart can help you organize your ideas as you work out what you want an API to be—its function, the calls it needs to make, the type of data it will acquire, what other developers need from this API, and so on.
Drawing a flowchart can help you map out how you want the API to work. Presenting your ideas in a visual chart is a good way to communicate complicated and technical ideas to an audience with varying degrees of technical knowledge and experience.
Use this API flowchart template to document API logic and visualize its data flow.
UML API diagram
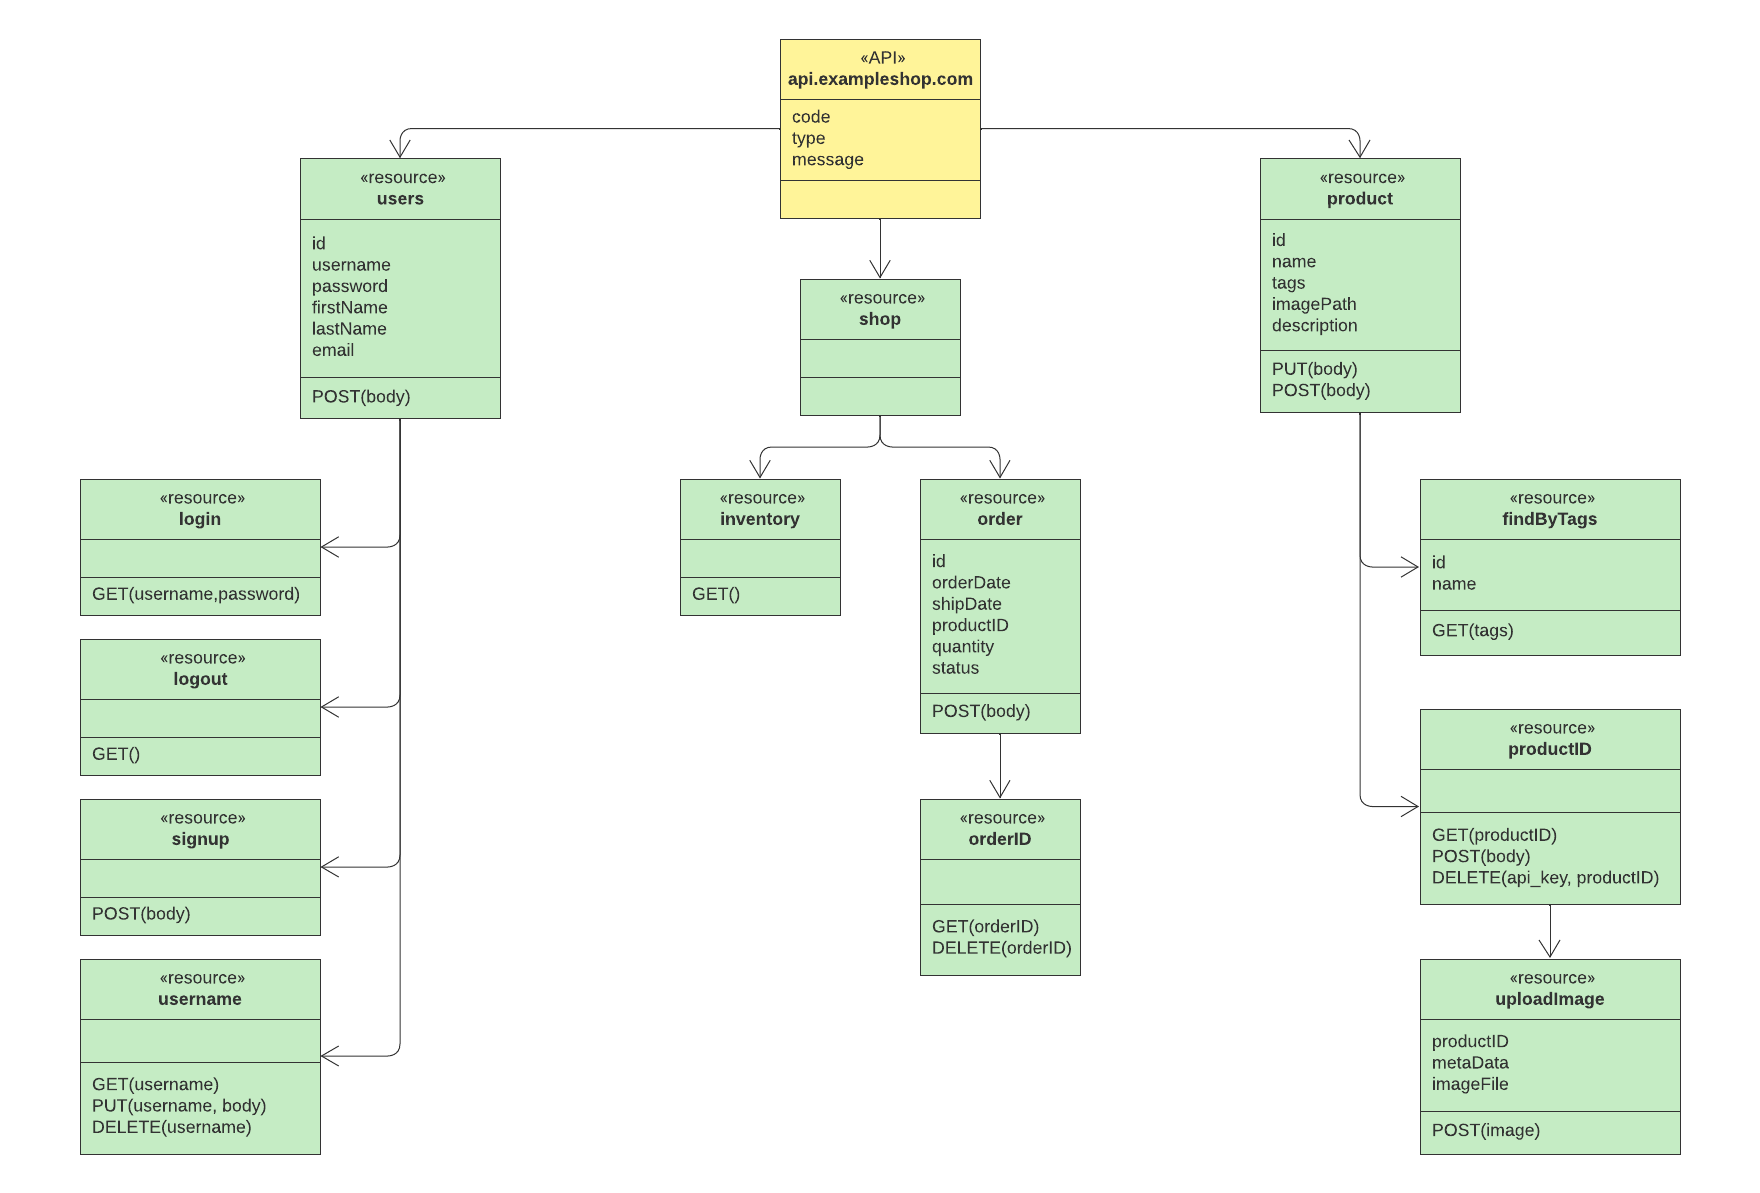
This UML API diagram template can help you to create a visual model of your API that can easily be communicated to everybody involved in the project. A visual model can help you:
- Plot how the traffic and data flows between objects
- Understand relationships between objects
- Define the attributes of those objects
This helps you to save time as you look at expected and unexpected outcomes, so you can see what works well and find what might need to be fixed.
Database ER diagram
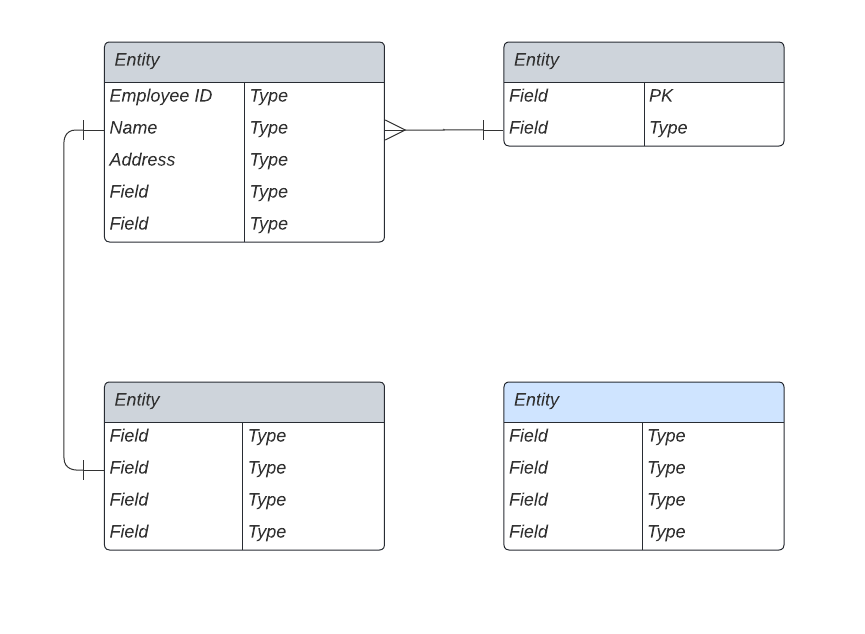
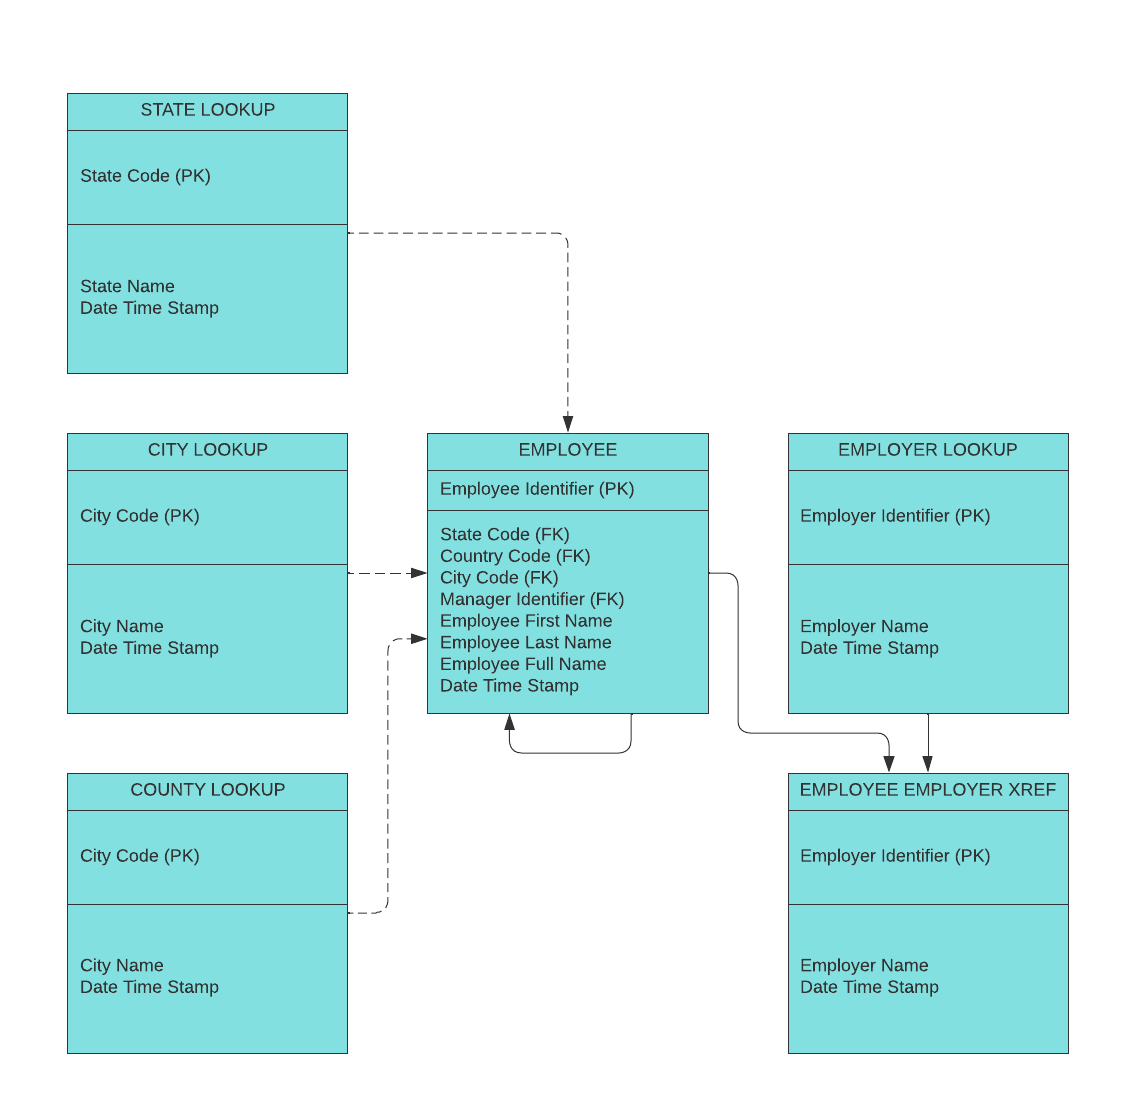
An entity-relationship diagram (ERD) helps you visualize how system entities relate to each other. These diagrams are useful for determining how a database should be structured. Using a standard set of shapes and symbols, you can document the logical structure of your database design.
With the language used in an ERD, entities act as nouns and relationships act like verbs. An entity can be a computer, employee, customer, location, event, and so on. Entities have attributes associated with them. For example, a customer entity might include attributes for name, address, payment information, subscriptions, etc.
Once your entities and attributes are defined, you can set up relationships that describe connections or associations between entity types.
You can choose from a number of ERD templates to help you design databases and define entities and relationships. For example, this crow’s foot ER diagram template lets you define entity relationship cardinality (one-to-one, one-to-many, and many-to-many).
DBMS ER diagram with UML notation
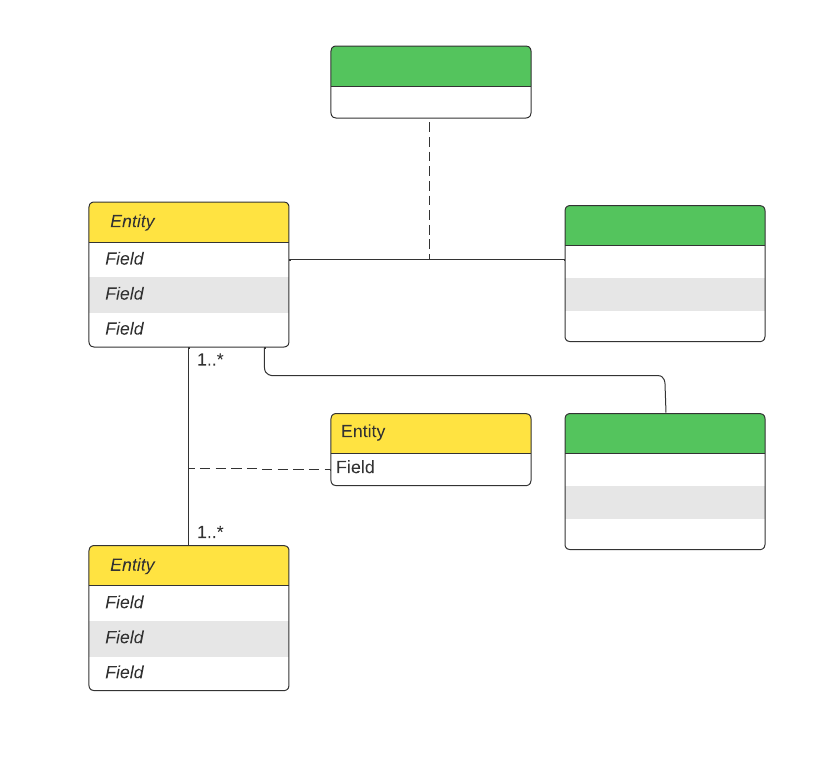
A DBMS ER diagram itself is not a type of UML diagram. The UML notation is only used to describe how entities relate to each other, and to indicate the cardinality of those relationships. For example, a connecting line that represents a relationship between two entities might include the notation 1..1 to indicate a one-to-one relationship.
This DBMS ER diagram template uses UML notation to help you design databases and define relationships between entities. You can easily collaborate with other team members on the same document to get their insights.
Logical data model
A data model is used to visualize how a database works. It lets you organize data elements and standardize how these elements relate to each other.
A conceptual data model represents the high-level design, concepts, and relationships within a system. These high-level models are typically used to communicate ideas and concepts between different teams, such as business analysts, IT, and management, as they work together to design a functional computer system.
Logical data models build off the conceptual data models and go into more technical detail. You can think of a logical data model as a blueprint or designer view of the data. It includes as much detail about the data as possible (attributes and relationships) but does not describe how the data is implemented.
This logical data model template can help you to provide more details about the data included in your system.
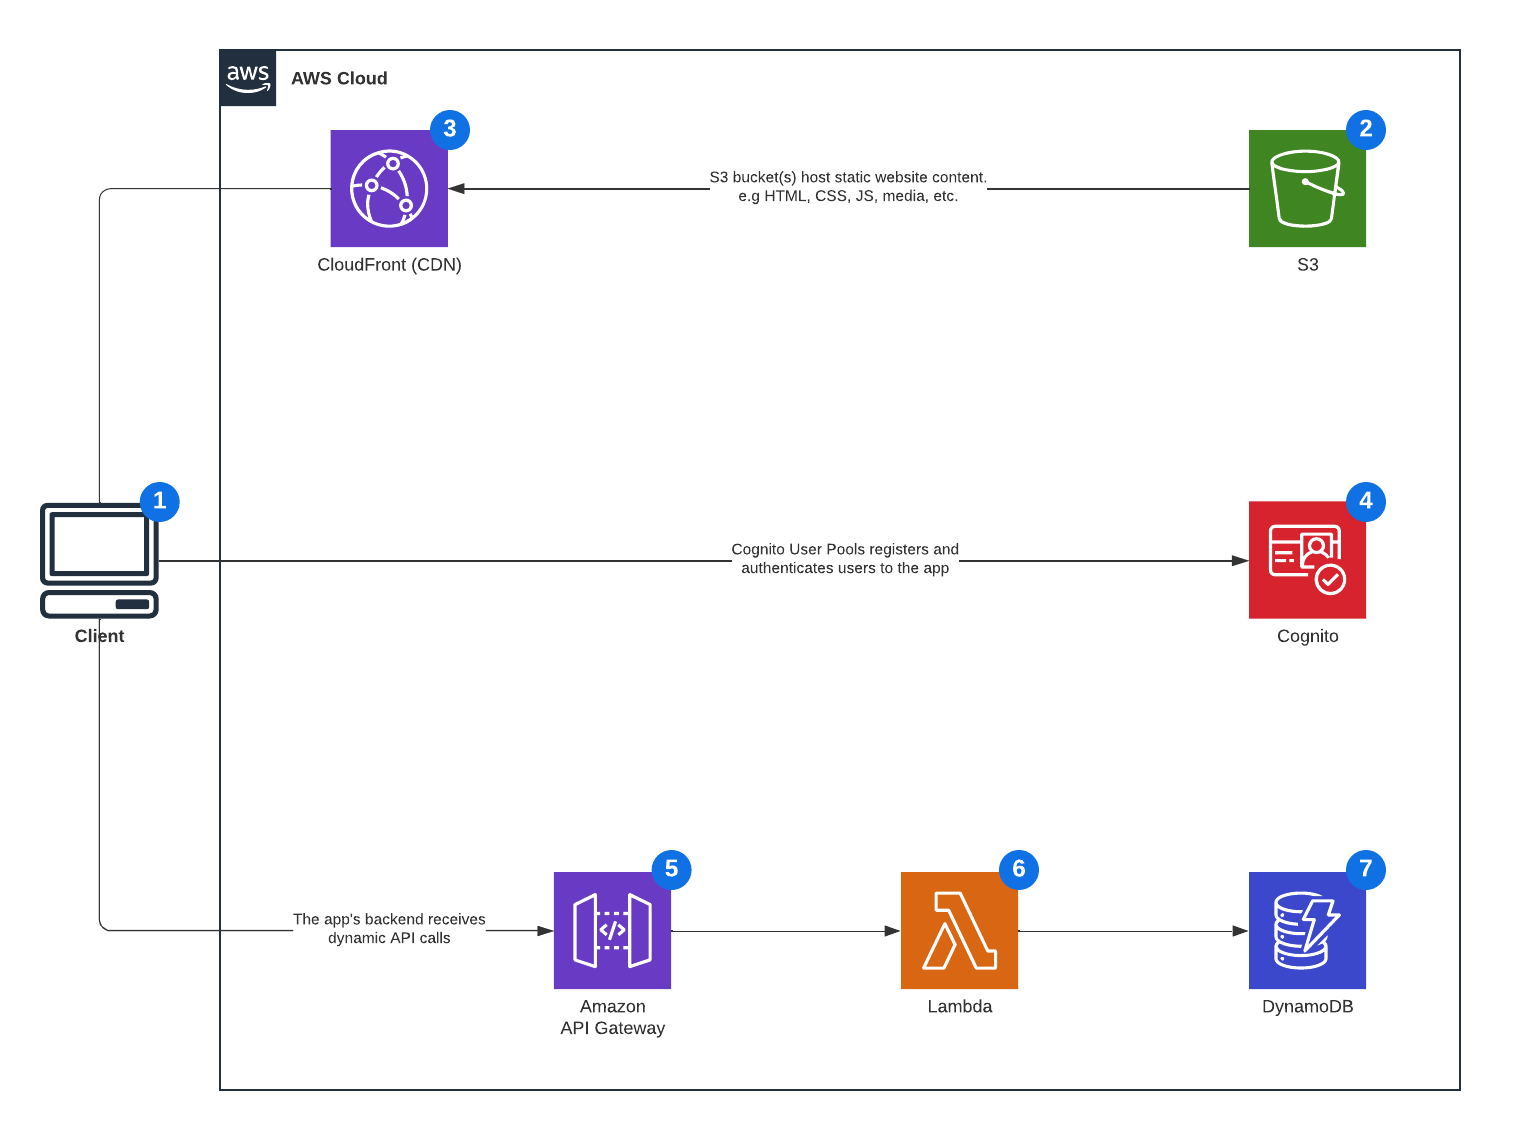
AWS serverless web app hosting
Our AWS serverless web app hosting template gives you what you need to understand your AWS serverless architecture, by visualizing the components of your architecture and customizing it to your use case.
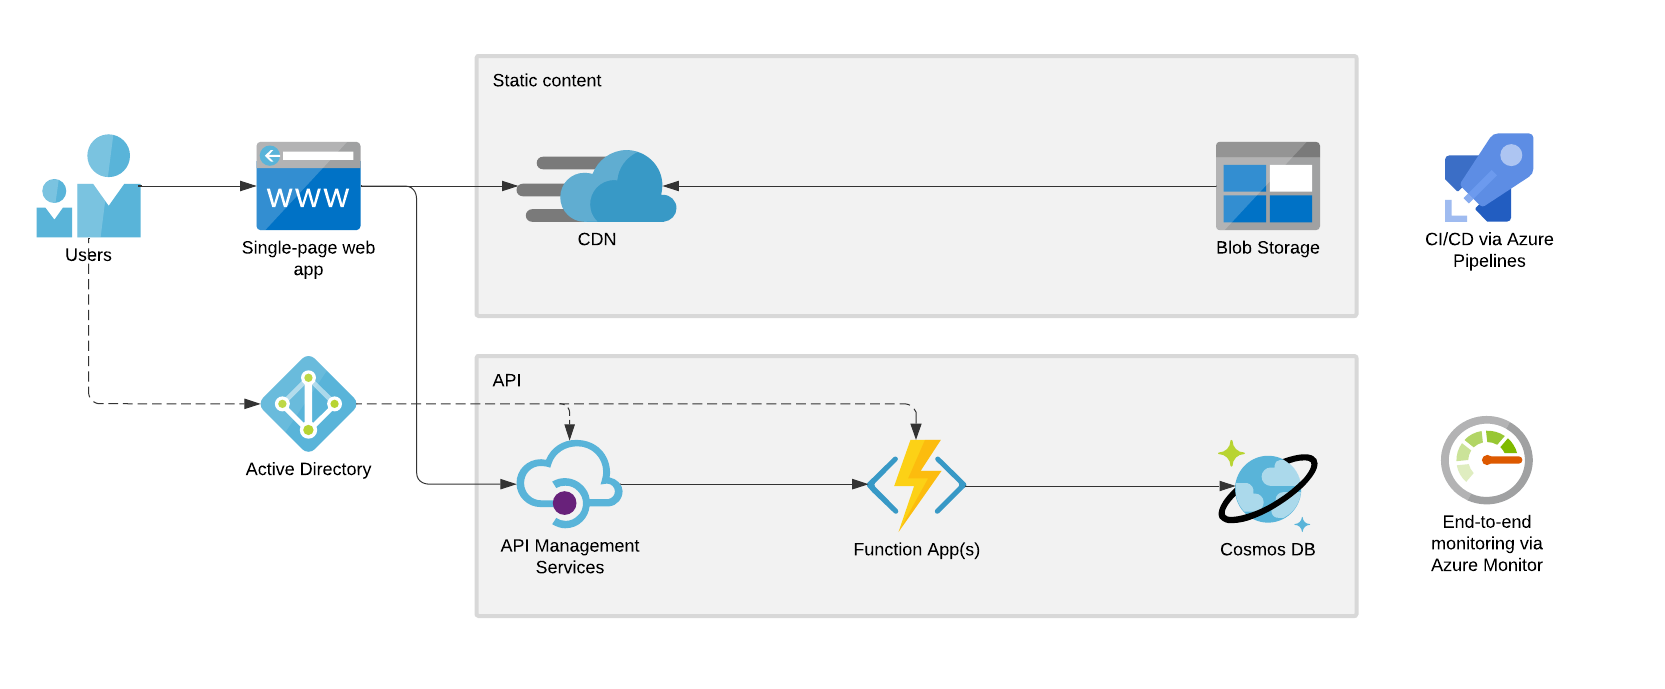
Azure serverless web app hosting
Azure web services from Microsoft also provide technologies that allow you to build serverless applications. This Azure serverless web app hosting template helps you to understand your Azure serverless architecture and how Azure handles information flows and interactions.

Try out these templates and dozens more by signing up for a Lucidchart account.
Sign up nowAbout Lucidchart
Lucidchart, a cloud-based intelligent diagramming application, is a core component of Lucid Software's Visual Collaboration Suite. This intuitive, cloud-based solution empowers teams to collaborate in real-time to build flowcharts, mockups, UML diagrams, customer journey maps, and more. Lucidchart propels teams forward to build the future faster. Lucid is proud to serve top businesses around the world, including customers such as Google, GE, and NBC Universal, and 99% of the Fortune 500. Lucid partners with industry leaders, including Google, Atlassian, and Microsoft. Since its founding, Lucid has received numerous awards for its products, business, and workplace culture. For more information, visit lucidchart.com.
Related articles
10 Lucidchart templates to help engineering teams reduce project disruptions
Here are 10 customizable templates to help your engineering teams stay productive and keep projects running smoothly.
Bring your bright ideas to life.
By registering, you agree to our Terms of Service and you acknowledge that you have read and understand our Privacy Policy.
