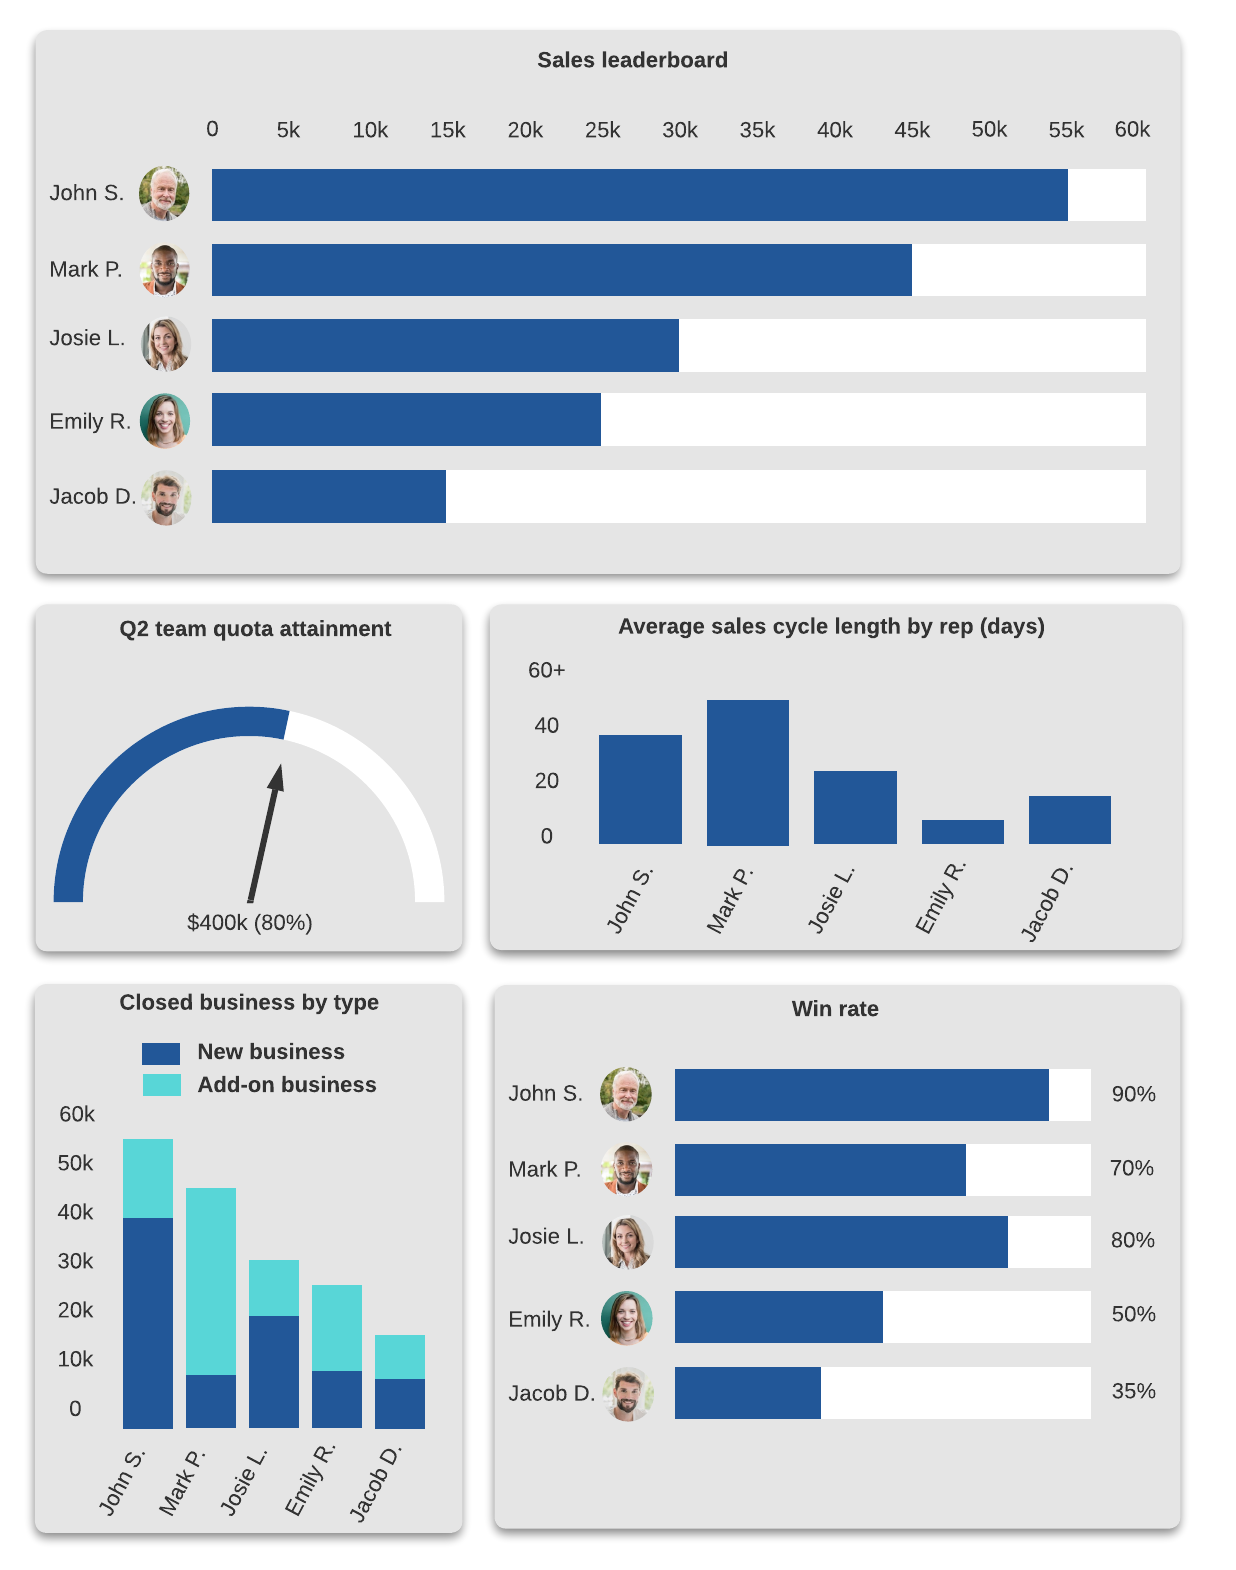
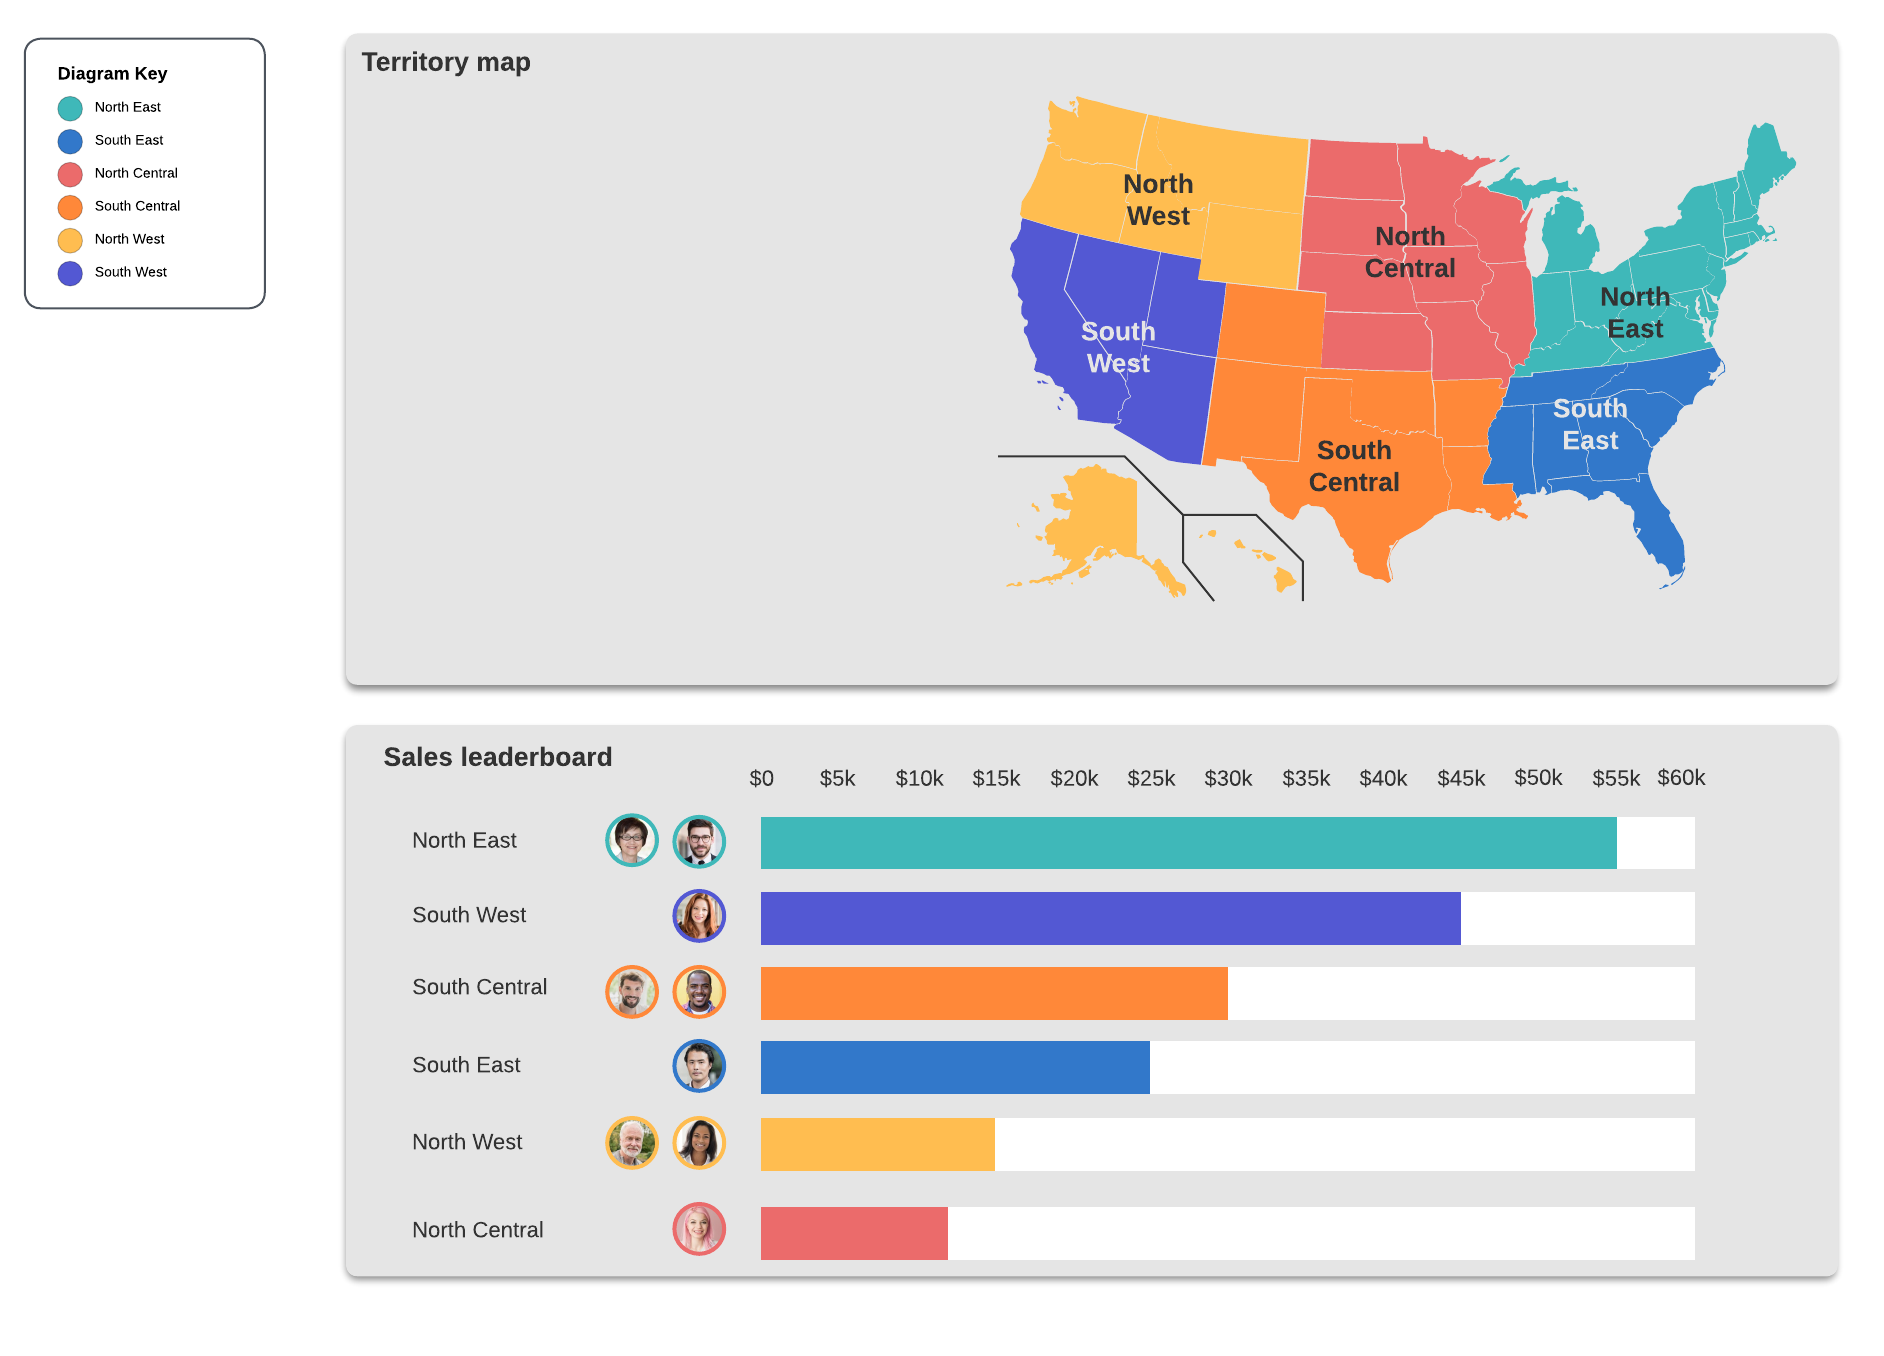
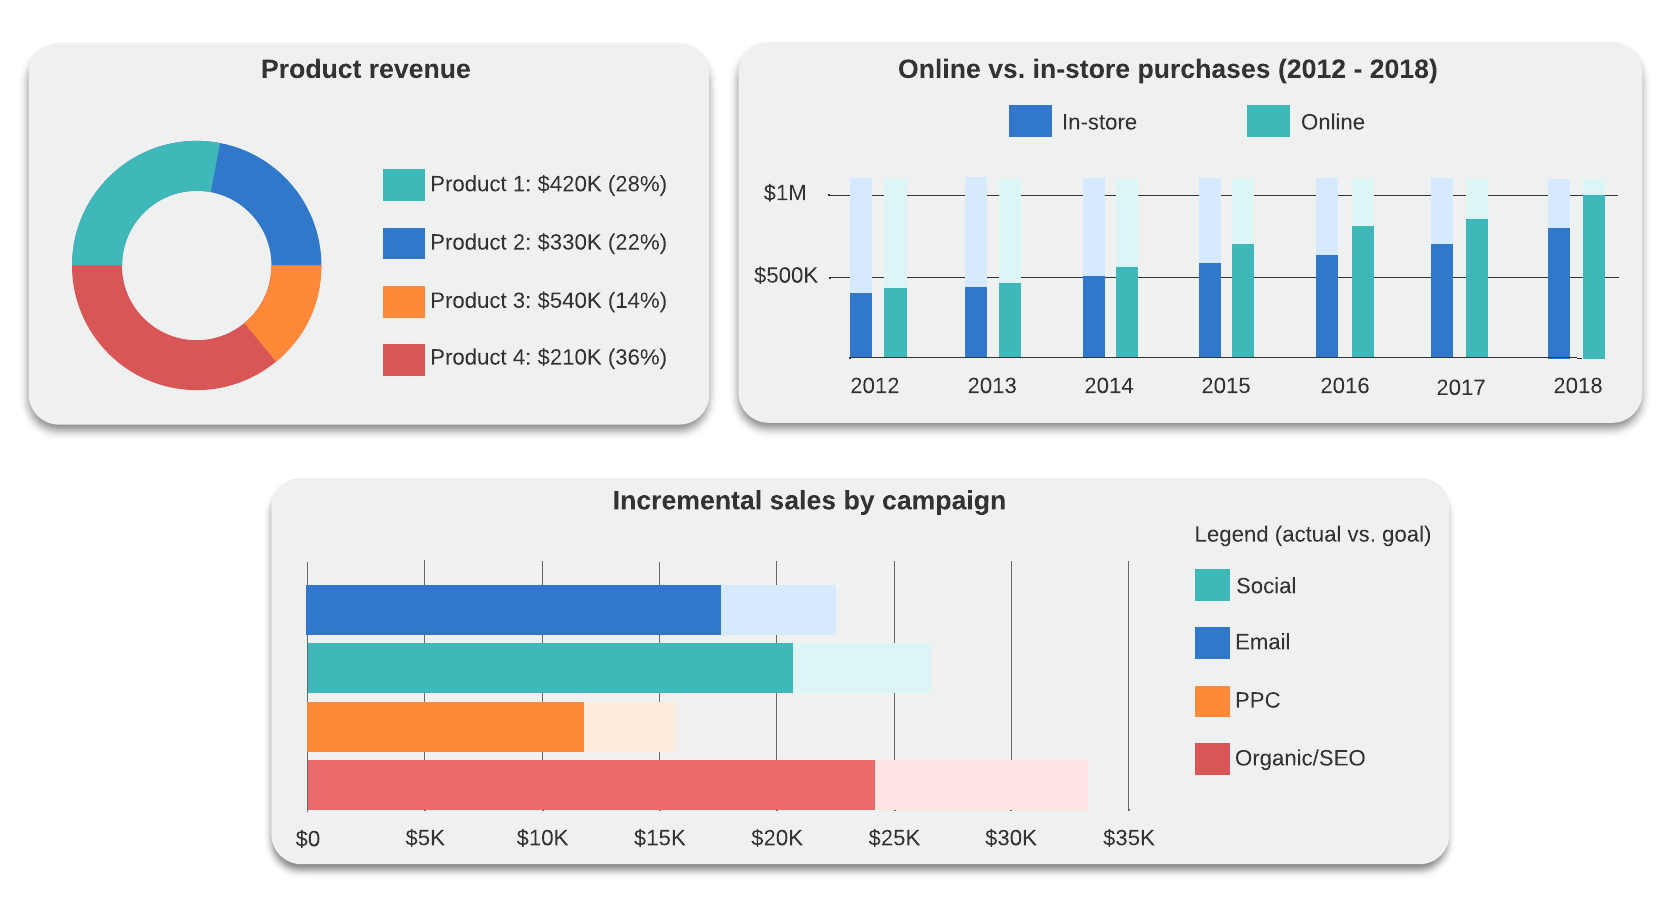
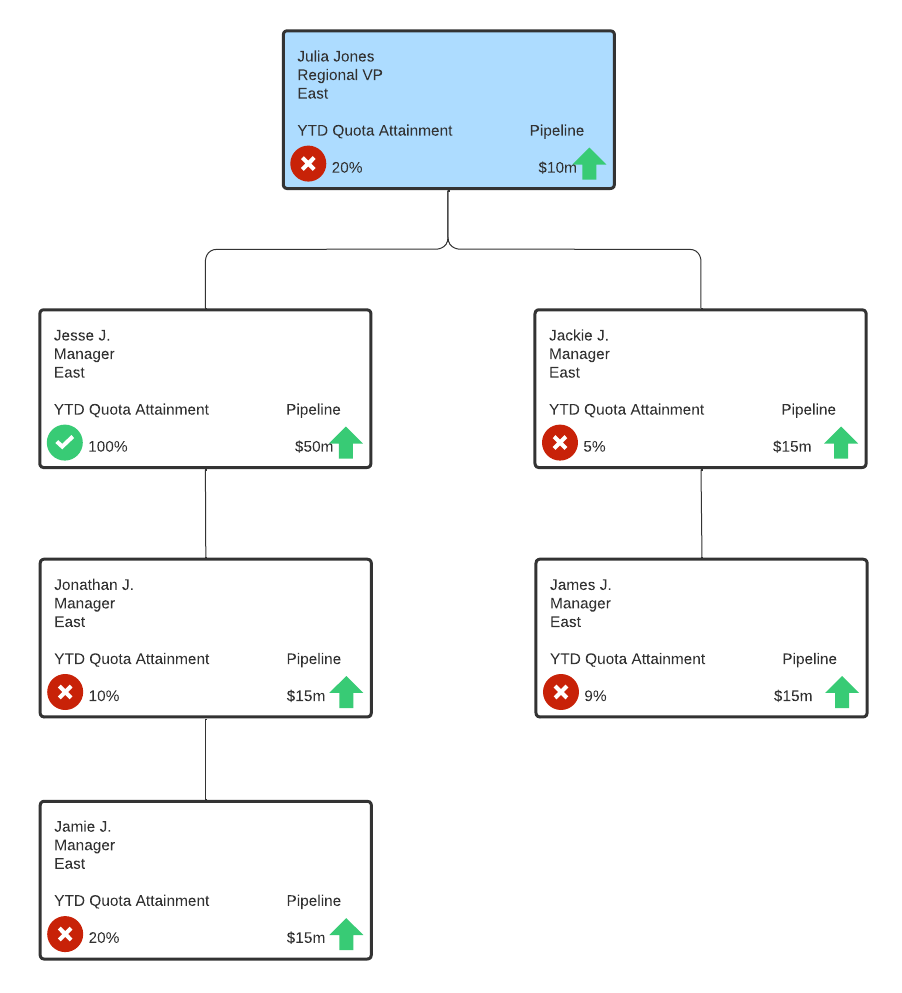
12 templates for sales managers

Reading time: about 4 min

Sales managers wear a lot of different hats and are responsible for a variety of goals. 

In this post, we’ll discuss some Lucidchart templates you can use to make your life easier as you set up processes and track your sales team’s performance. 

Templates for setting up processes

Sales funnel

This sales funnel template is modeled after an AIDA (awareness, interest, decision, action) approach. Each stage of the funnel represents potential customers who will buy your product. Each stage represents fewer potential customers because those who are unqualified or uninterested will drop off along the journey until you close the deal at the bottom of the funnel. 

sales funnel template
Sales funnel example (click on image to modify online)

Marketing and sales service level agreement

A marketing and sales service level agreement is a kind of contract between the two departments that outlines processes, actions, timeline, goals, and objectives that each are responsible for to ensure growth for the business. A service level agreement helps your teams to communicate and collaborate more effectively.


marketing and sales service level agreement
Marketing and sales service level agreement (click on image to modify online)

7-step sales process

The sales process includes these seven steps: prospecting, preparation, approach, presentation, handling objections, closing, and follow-up. The first three steps include research to determine what your prospects want or need. The fourth step involves presenting how your product can meet those needs. The remaining steps are used to address customer concerns, close the deal, and work to retain customer loyalty. 

Use this 7-step sales process template as a guide for developing a process that works for you and your team.

7-step sales process template
7-step sales process template (click on image to modify online)

Objections flowchart

Prospects might have objections to or doubts about your products or brand. An objections flowchart can help you to anticipate what some of these objections might be so you can be better prepared to address them. 


Objections flowchart example
Objections flowchart example (click on image to modify online)

Owned accounts

This owned accounts template can be used to map how sales representatives should process leads and hand off leads to account managers. Customize this flowchart to define which type of accounts go to specific managers.


Owned accounts template
Owned accounts template (click on image to modify online)

Account prioritization

This account prioritization template can help you to determine which of your customer accounts are the most valuable—including the actual vs. potential value of each account. That way, you’ll know where to focus your efforts.


Account prioritization example
Account prioritization example (click on image to modify online)

Templates for tracking sales performance

KPI and sales activity dashboard

Customize this KPI and sales activity dashboard to keep track of how your sales team is performing against your goals.


KPI and sales activity dashboard
KPI and sales activity dashboard (click on image to modify online)

Lead funnel dashboard

This example of a lead funnel dashboard helps you to understand how well your sales and marketing teams are working together. Customize this dashboard to track data that helps you to identify what’s working well and what needs to be refined.


lead funnel dashboard example
Lead funnel dashboard example (click on image to modify online)

Sales leaderboard

You can customize this sales leaderboard to show how sales representatives are tracking toward meeting their sales quotas. Making the dashboard easily accessible can keep everybody on track and help motivate the team to reach their full potential.


sales leadership dashboard
Sales leadership dashboard (click on image to modify online)

Sales territory map and leaderboard

This sales territory map and leaderboard lets you track the progress of sales teams in various territories throughout the world. This can give you insight into the strengths and weaknesses in each territory. An analysis of these strengths and weaknesses can help you to compare and contrast trends and patterns that work well in one market so you can determine why they don’t work in other markets. Your analysis can also help you to identify where the leaders in each sales territory might need some additional training.

Like the sales leaderboard, a sales territory map and leaderboard can be good for motivating your sales teams as they measure their success against other territories.  


sales territory map and leaderboard
Sales territory map and leaderboard (click on image to modify online)

Sales product performance dashboard

Customize this sales product performance dashboard to visualize which products are best sellers, which marketing campaigns are working, and so on.


sales product performance dashboard
Sales product performance dashboard (click on image to modify online)

Team member performance

This sales performance template lets you track individual team member performance. You can use Lucidchart’s data linking features to automatically populate your diagrams with data like sales rep name, assigned territory, assigned products, performance against quotas, etc. This type of diagram gives you a good overview of how well each team member is doing.


sales performance template
Sales performance template (click on image to modify online)

Try out these templates and dozens more by signing up for a Lucidchart account.

Sign up now

Popular now

how to make a flowchart in google docsHow to make a flowchart in Google Docs

Sign up to get the latest Lucidchart updates and tips delivered to your inbox once a month.

Subscribe to our newsletter

About Lucidchart

Lucidchart is the intelligent diagramming application that empowers teams to clarify complexity, align their insights, and build the future—faster. With this intuitive, cloud-based solution, everyone can work visually and collaborate in real time while building flowcharts, mockups, UML diagrams, and more.

The most popular online Visio alternative, Lucidchart is utilized in over 180 countries by millions of users, from sales managers mapping out target organizations to IT directors visualizing their network infrastructure.

Related posts:

How to forecast sales: A pocket guide for sales managers

how to forecast sales

3 surefire ways to improve sales performance

how to improve sales performance

Get started

  • Pricing
  • Individual
  • Team
  • Enterprise
  • Contact sales
PrivacyLegalCookies

© 2023 Lucid Software Inc.