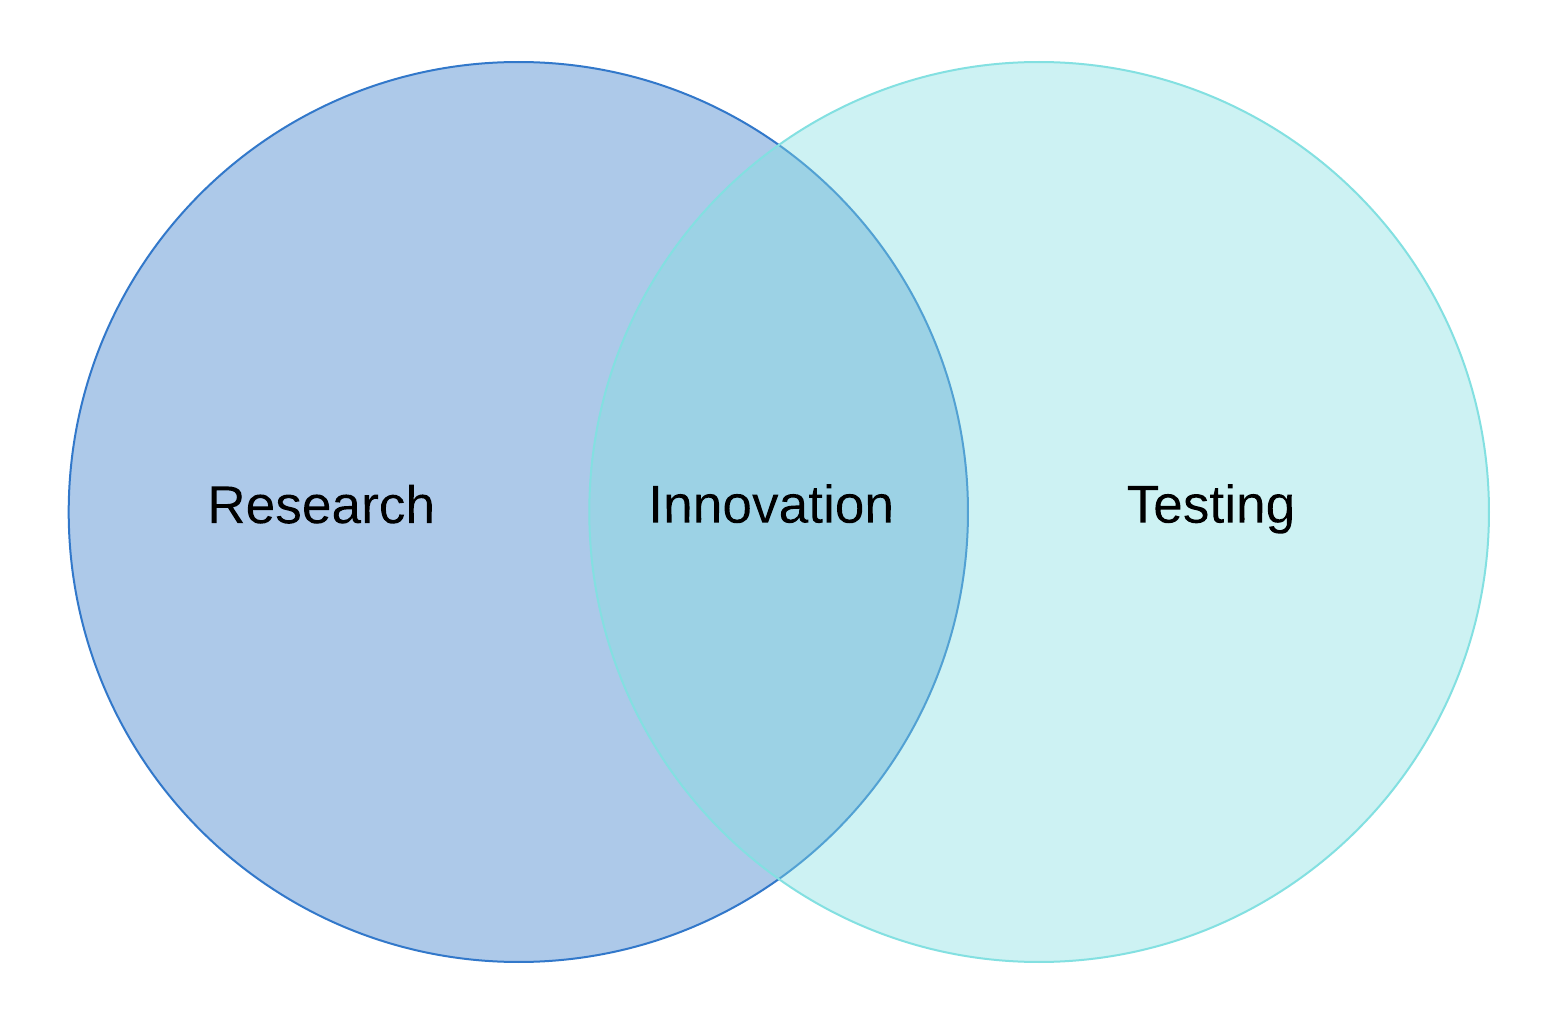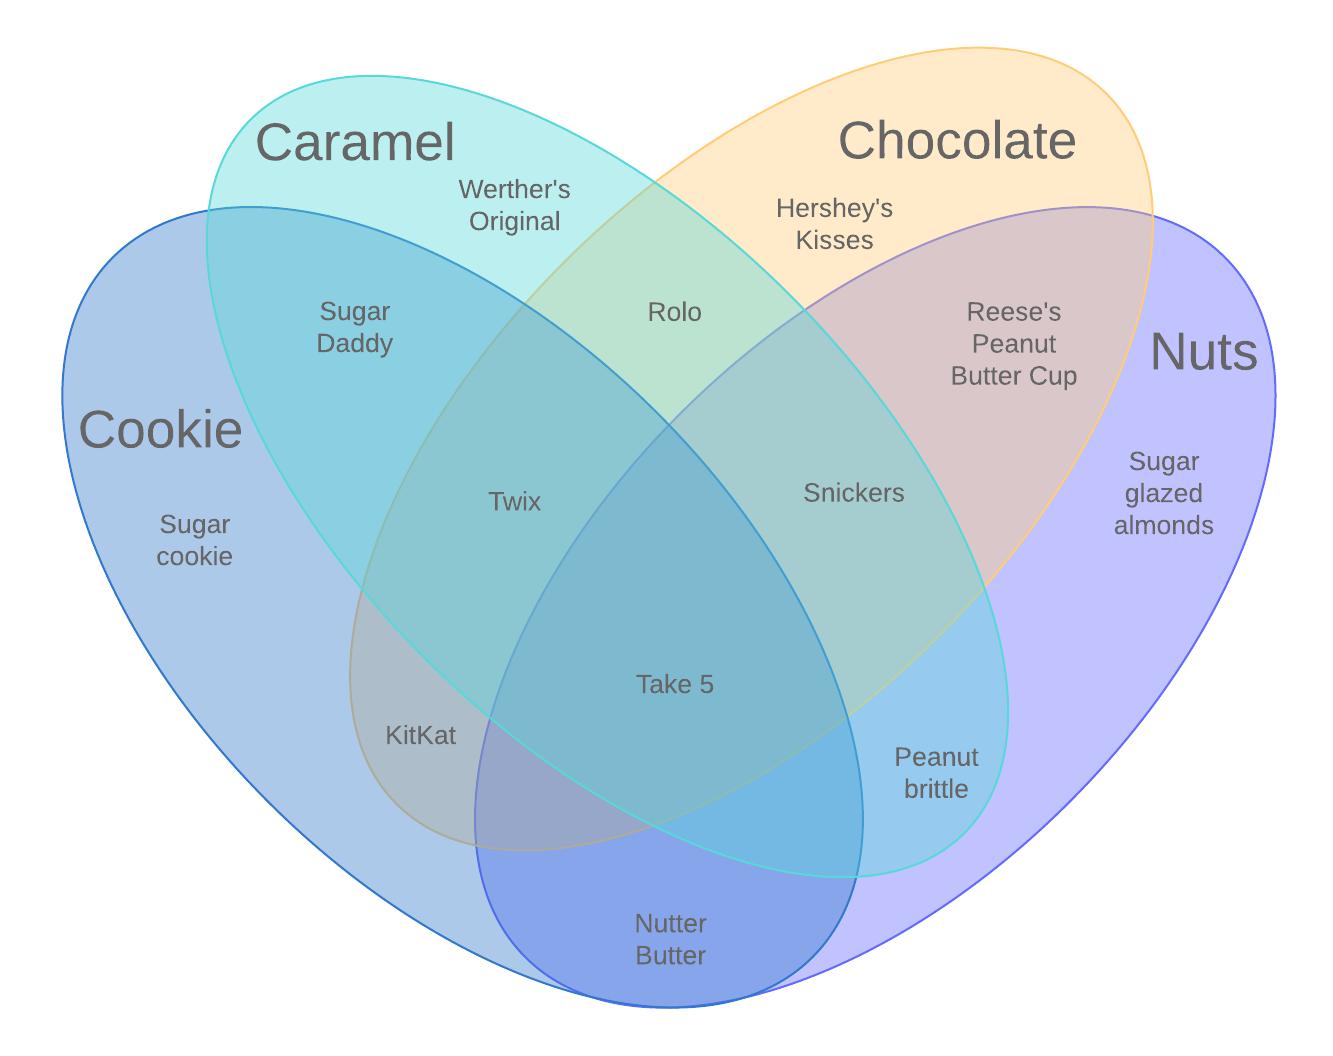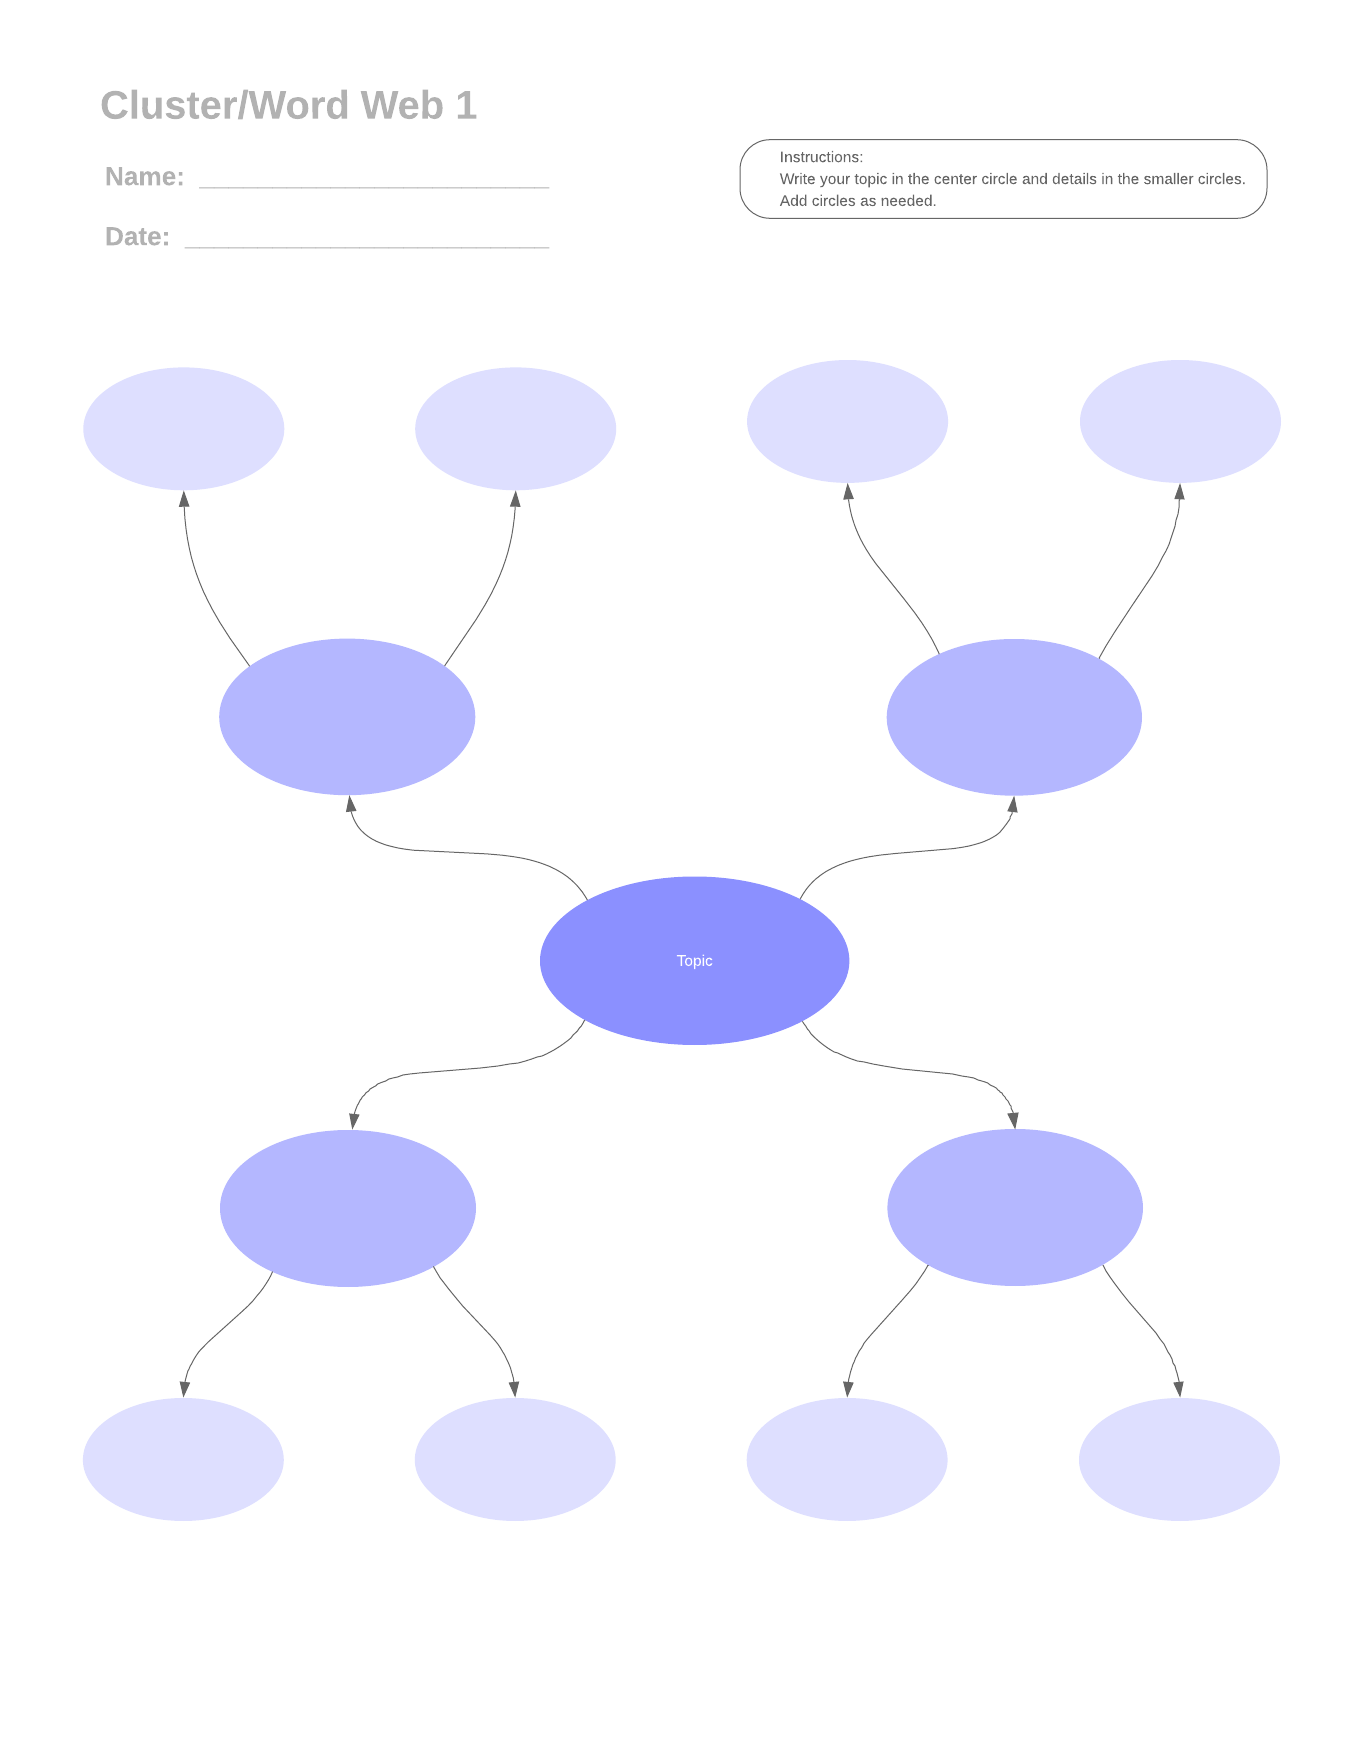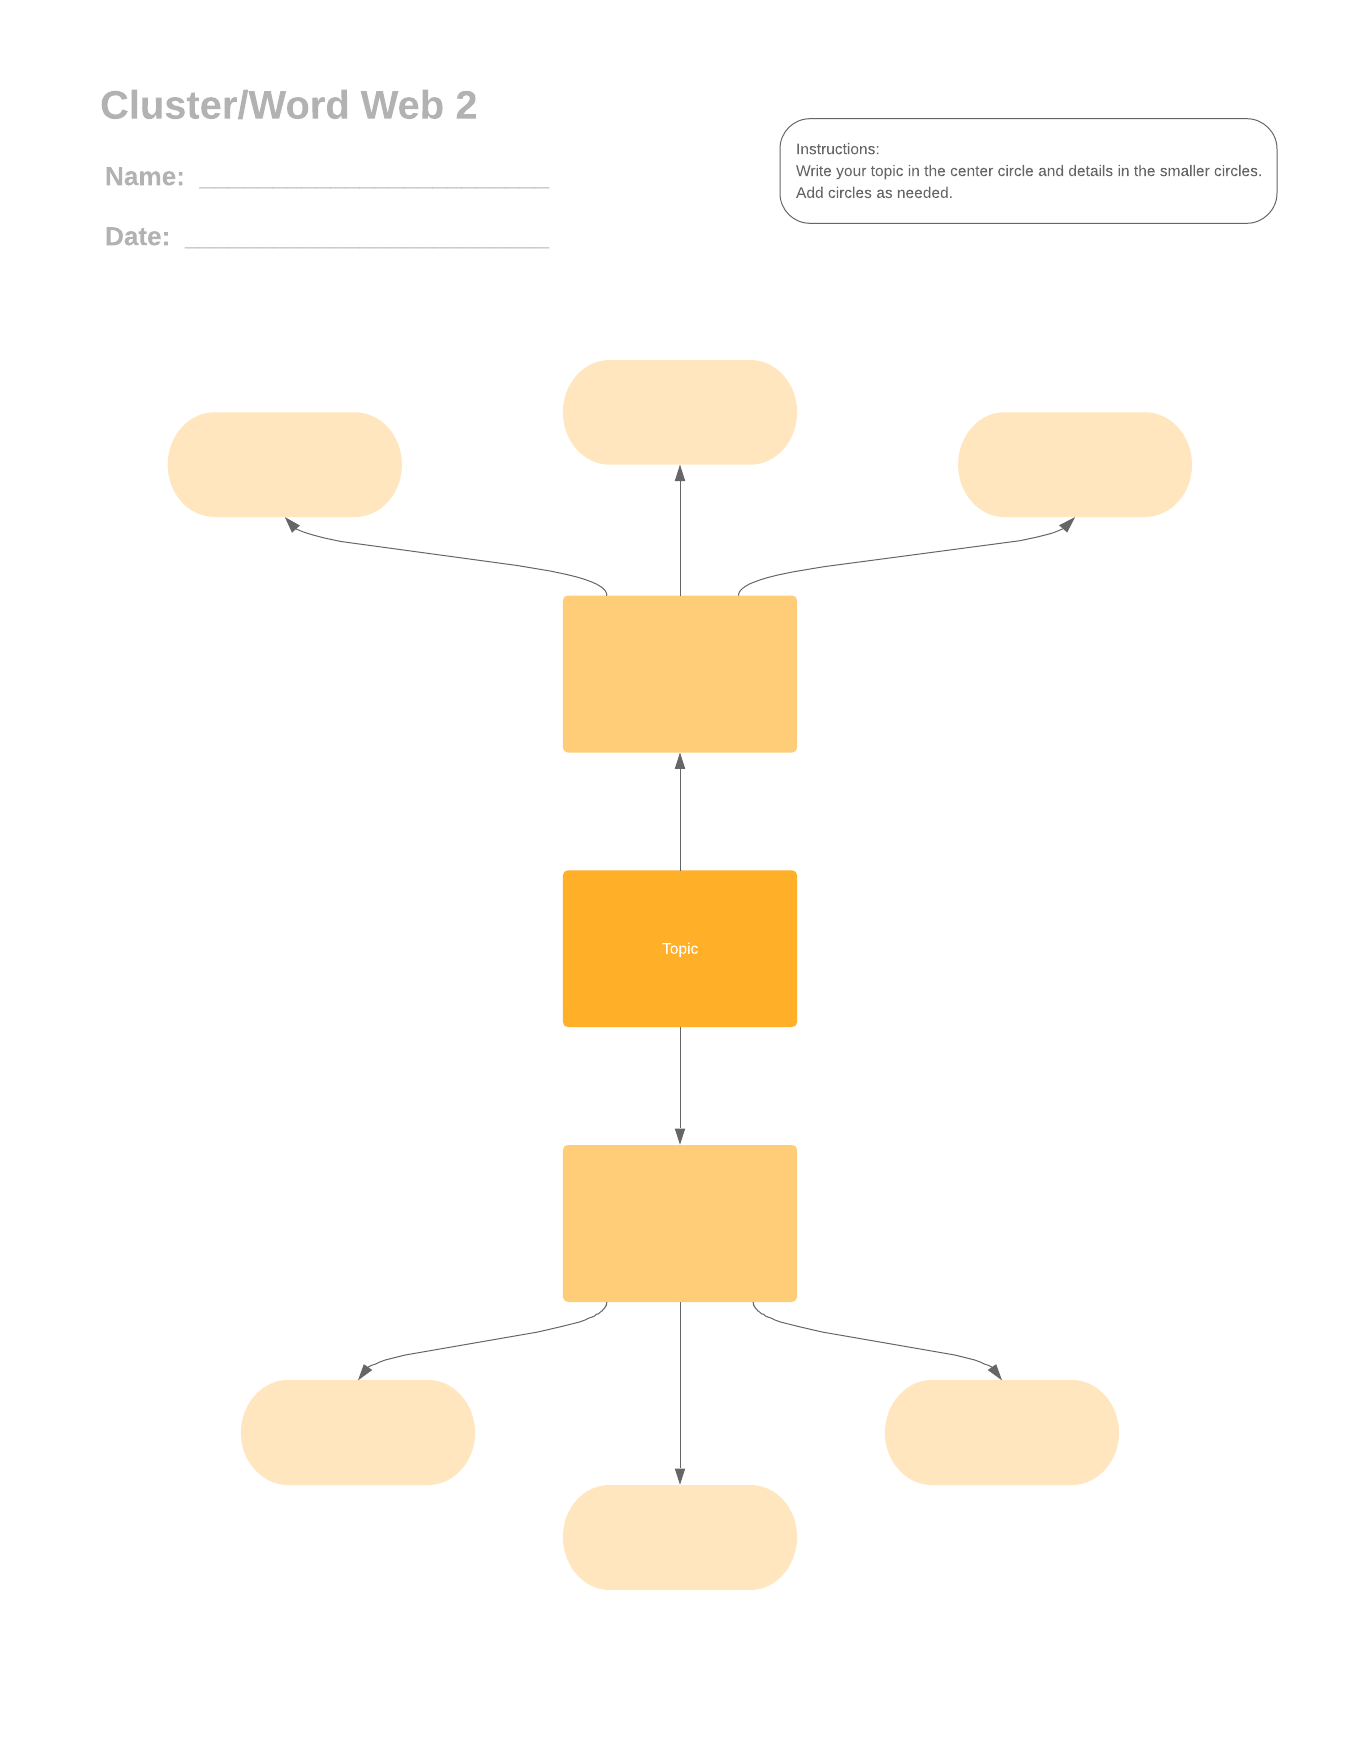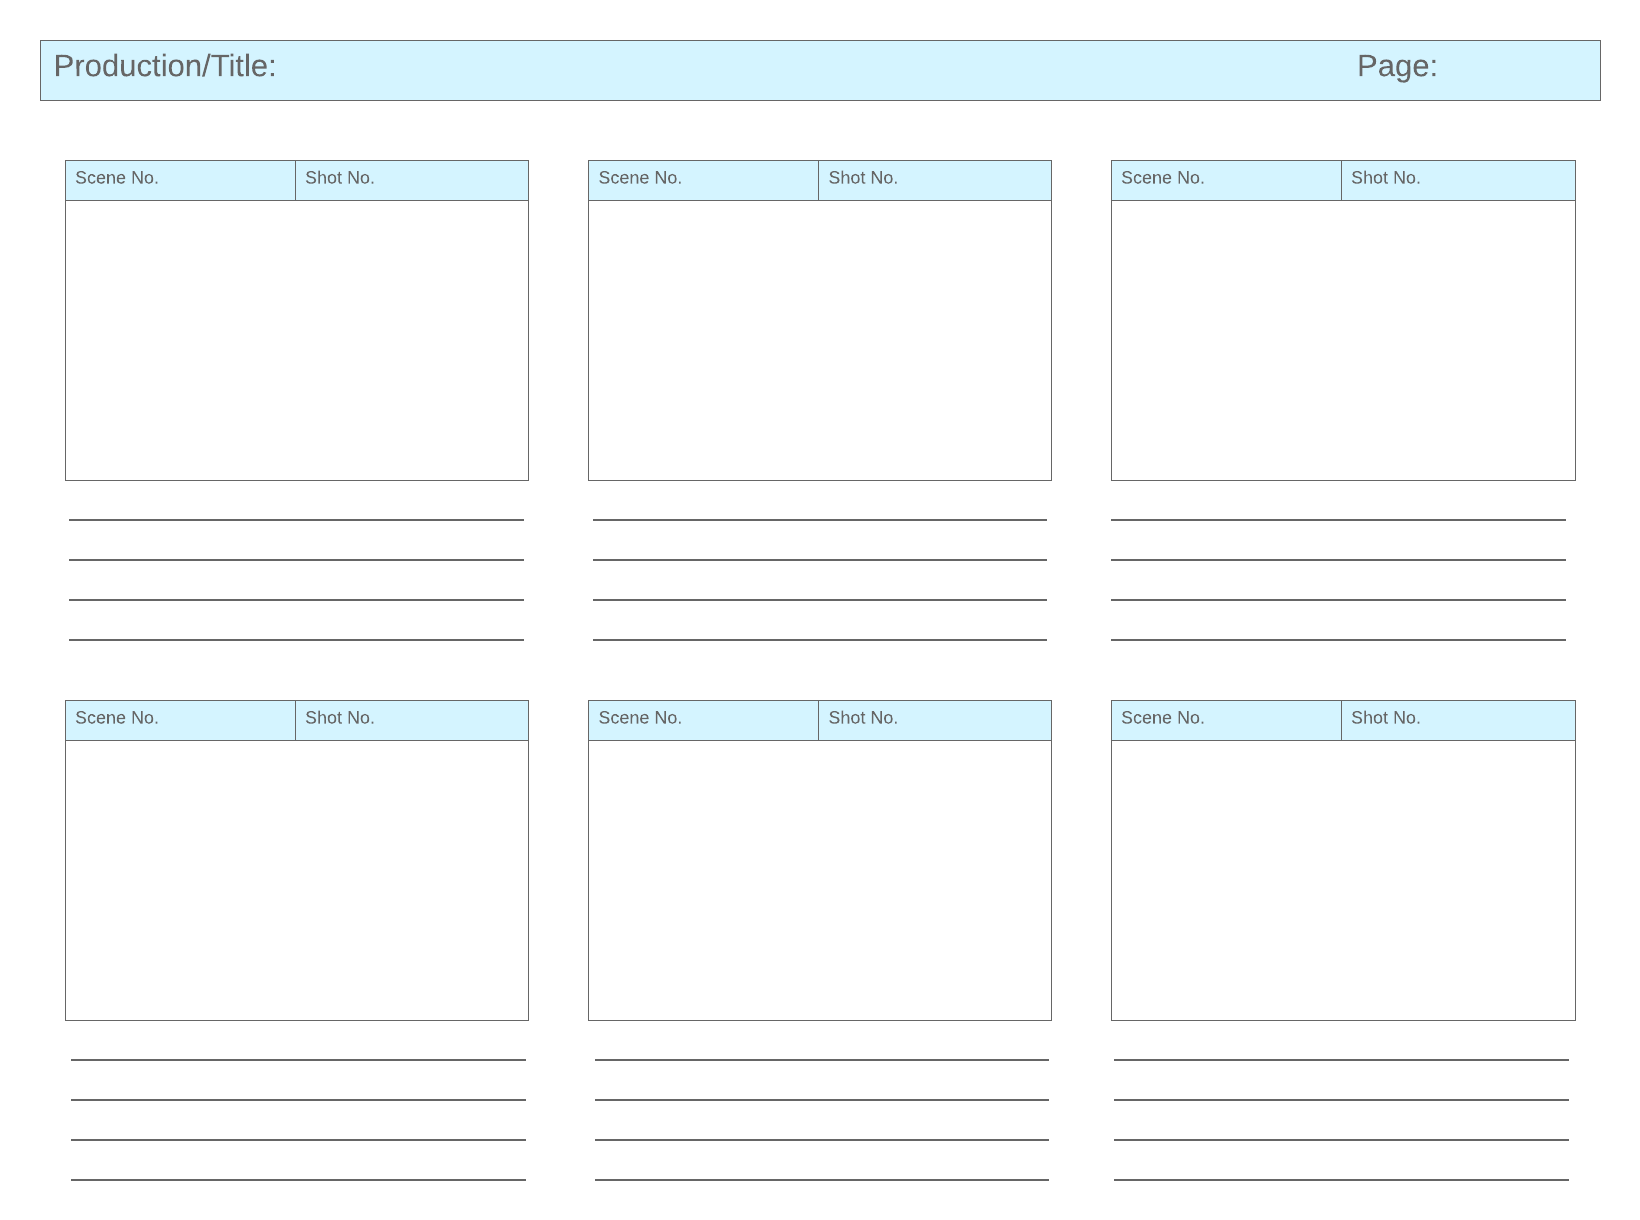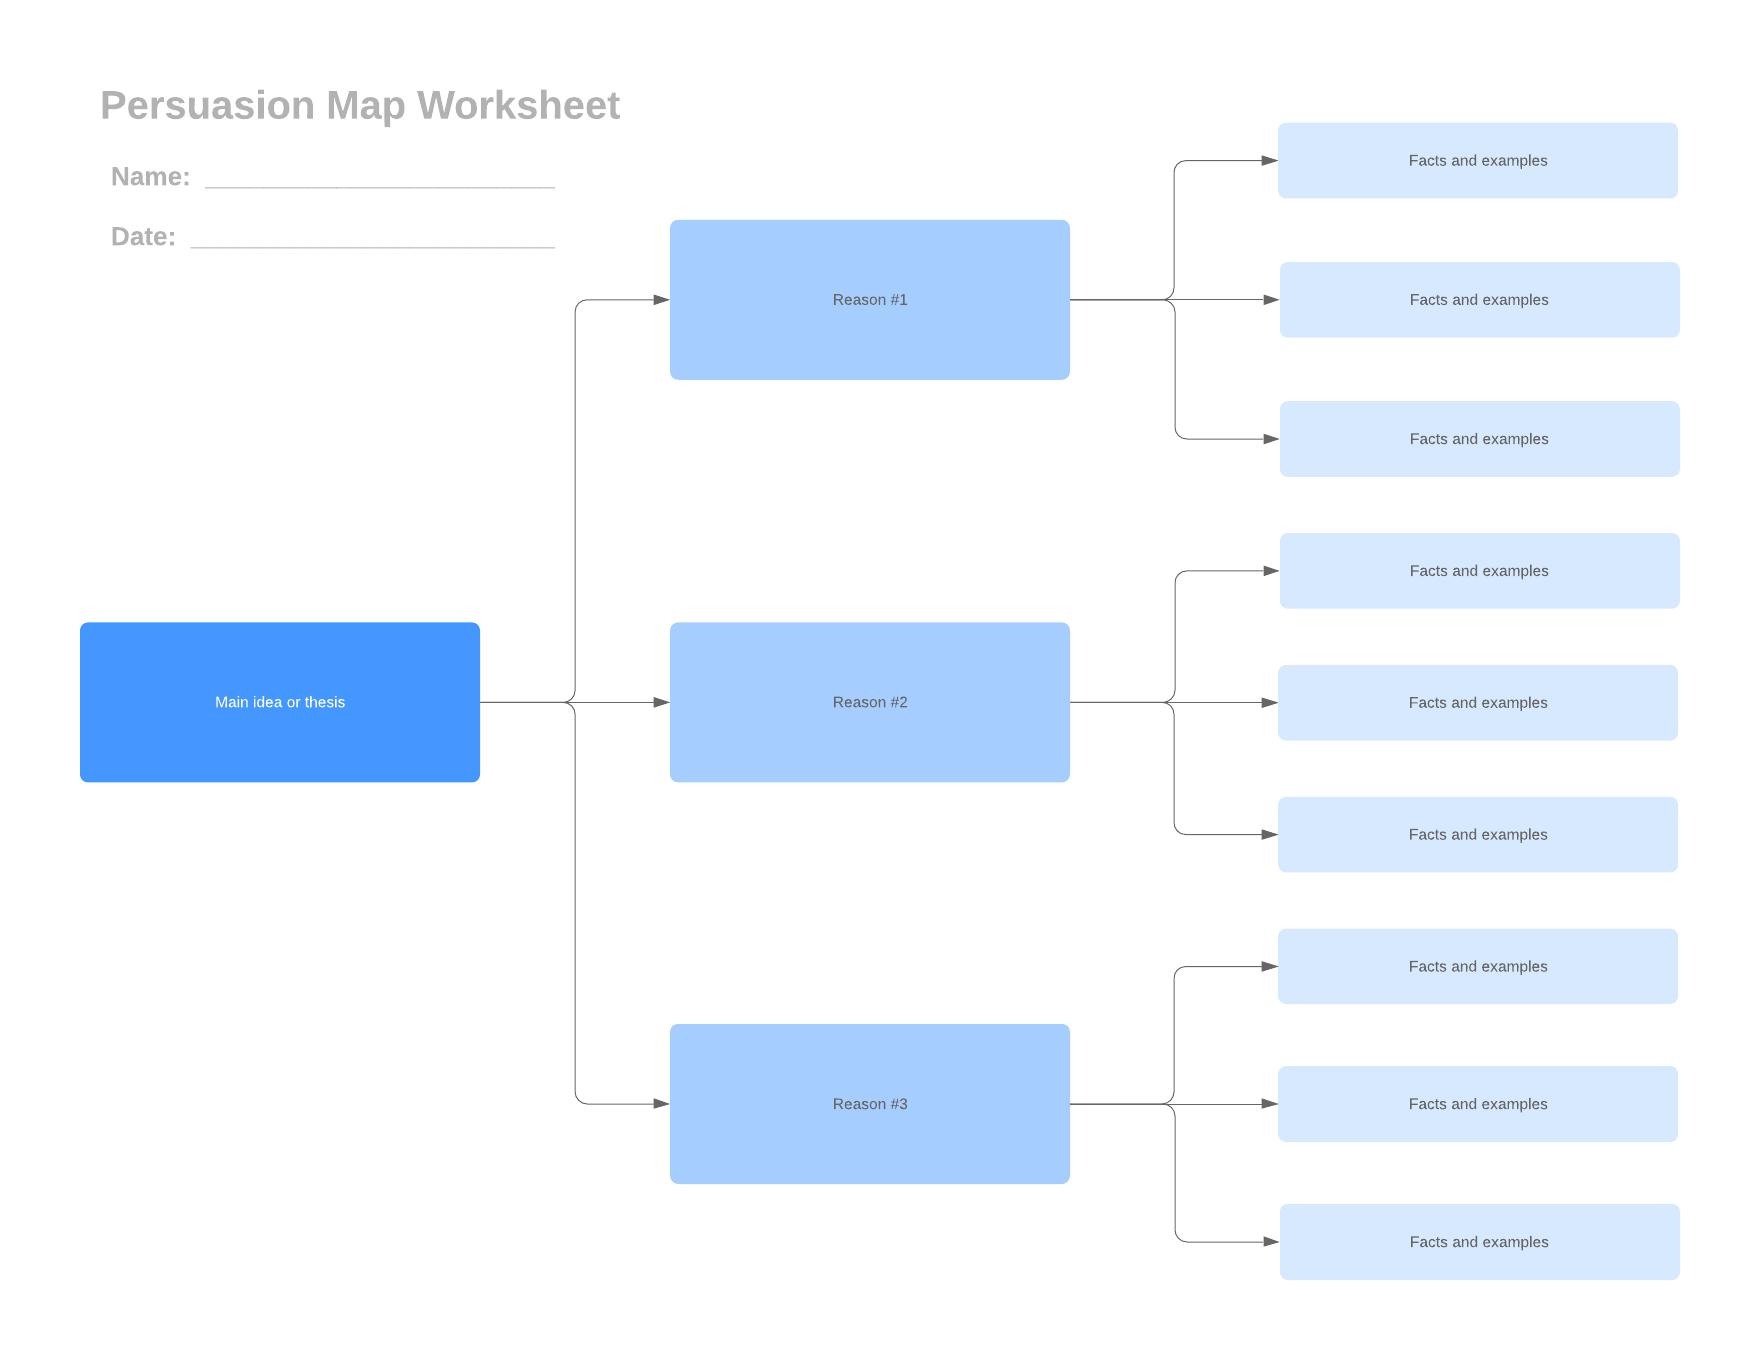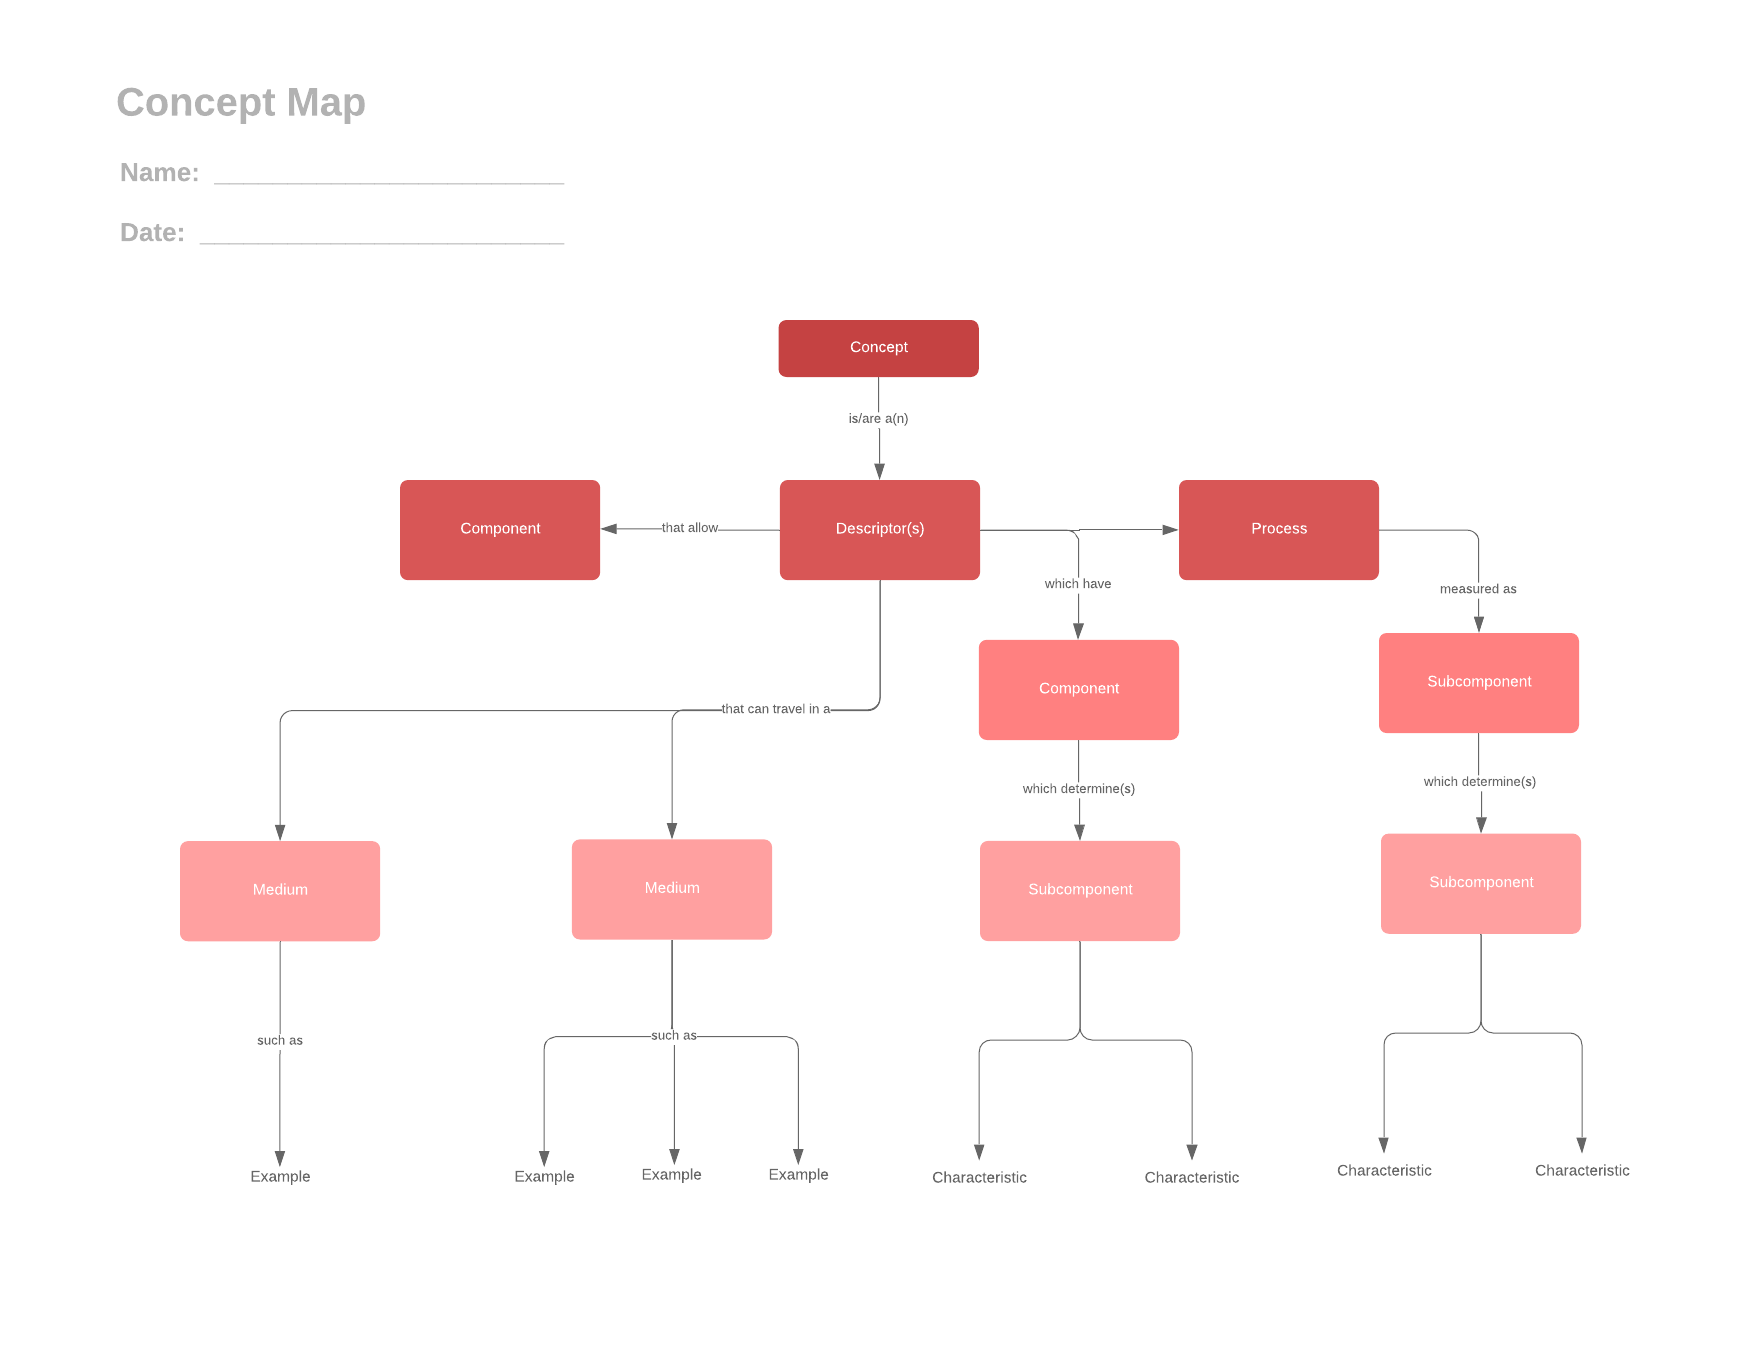
7 types of graphic organizers for education
Reading time: about 7 min
About Lucidchart
Lucidchart, a cloud-based intelligent diagramming application, is a core component of Lucid Software's Visual Collaboration Suite. This intuitive, cloud-based solution empowers teams to collaborate in real-time to build flowcharts, mockups, UML diagrams, customer journey maps, and more. Lucidchart propels teams forward to build the future faster. Lucid is proud to serve top businesses around the world, including customers such as Google, GE, and NBC Universal, and 99% of the Fortune 500. Lucid partners with industry leaders, including Google, Atlassian, and Microsoft. Since its founding, Lucid has received numerous awards for its products, business, and workplace culture. For more information, visit lucidchart.com.
Related articles
How to Use Graphic Organizers to Write Better Essays
If you’re a student, there’s no way around it: You’re going to have to write essays. But there is an easier way to brainstorm, structure, and write the perfect essay. Learn how graphic organizers can help and get started with templates from Lucidchart.
Harnessing the power of KWL charts in education
A KWL chart is a simple graphic organizer that empowers students to own their learning and helps teachers curate the most engaging lessons. Learn how you can incorporate KWL charts into your classroom.
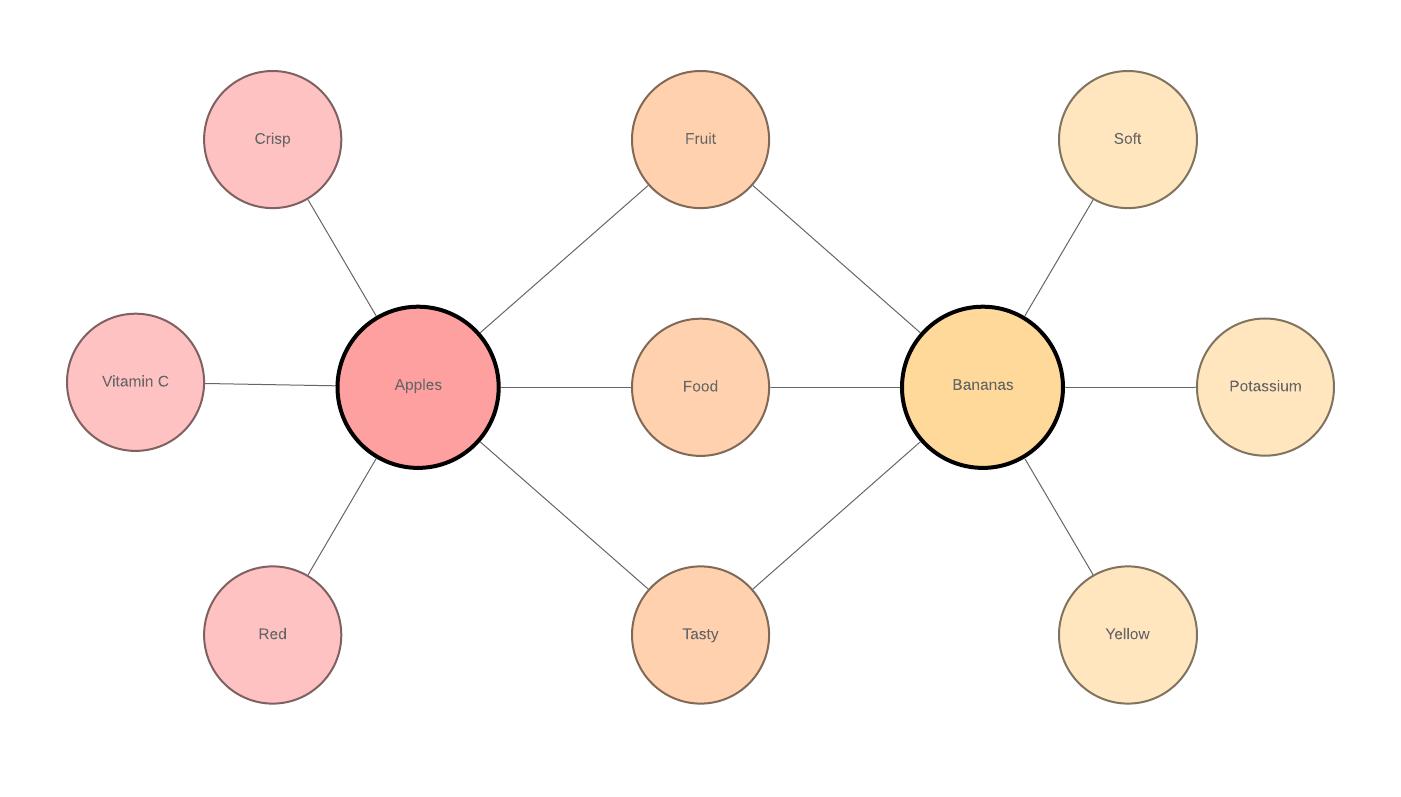
All about hub-and-spoke diagrams (+ template to make your own!)
Learn the value of hub-and-spoke diagrams and how to make them. Includes a template to get started!
Bring your bright ideas to life.


By registering, you agree to our Terms of Service and you acknowledge that you have read and understand our Privacy Policy.