using visuals to drive strategy

How to use visuals to drive strategy through challenging times

Reading time: about 6 min

Topics:

  • Leadership

Leading through a crisis is never easy. When you’re constantly putting out new fires every day—sometimes every hour—it can be difficult to see beyond current challenges and plan ahead for recovery when the crisis is over.

But being able to see through the weeds and plan accordingly is crucial for surviving crises and thriving on the other side.

Although no one can predict the future, there are ways to prepare strategically so that you and your business are positioned for long-term success. 

In a recent article, Gartner outlined a 3-phase framework for navigating the COVID-19 crisis successfully. This framework is a useful pattern for leading through any crisis with confidence.

The three phases are: 

  • Triage: The beginning of a crisis. It requires prompt action to lower operating costs. 
  • Doldrums: The threat levels off (e.g., cases stop increasing) and things are relatively quiet. This is a time for sustaining current initiatives and beginning growth investments. 
  • Recovery: Extraordinary measures are over, though budgets remain tight. Optimism rises, and there is higher investment.

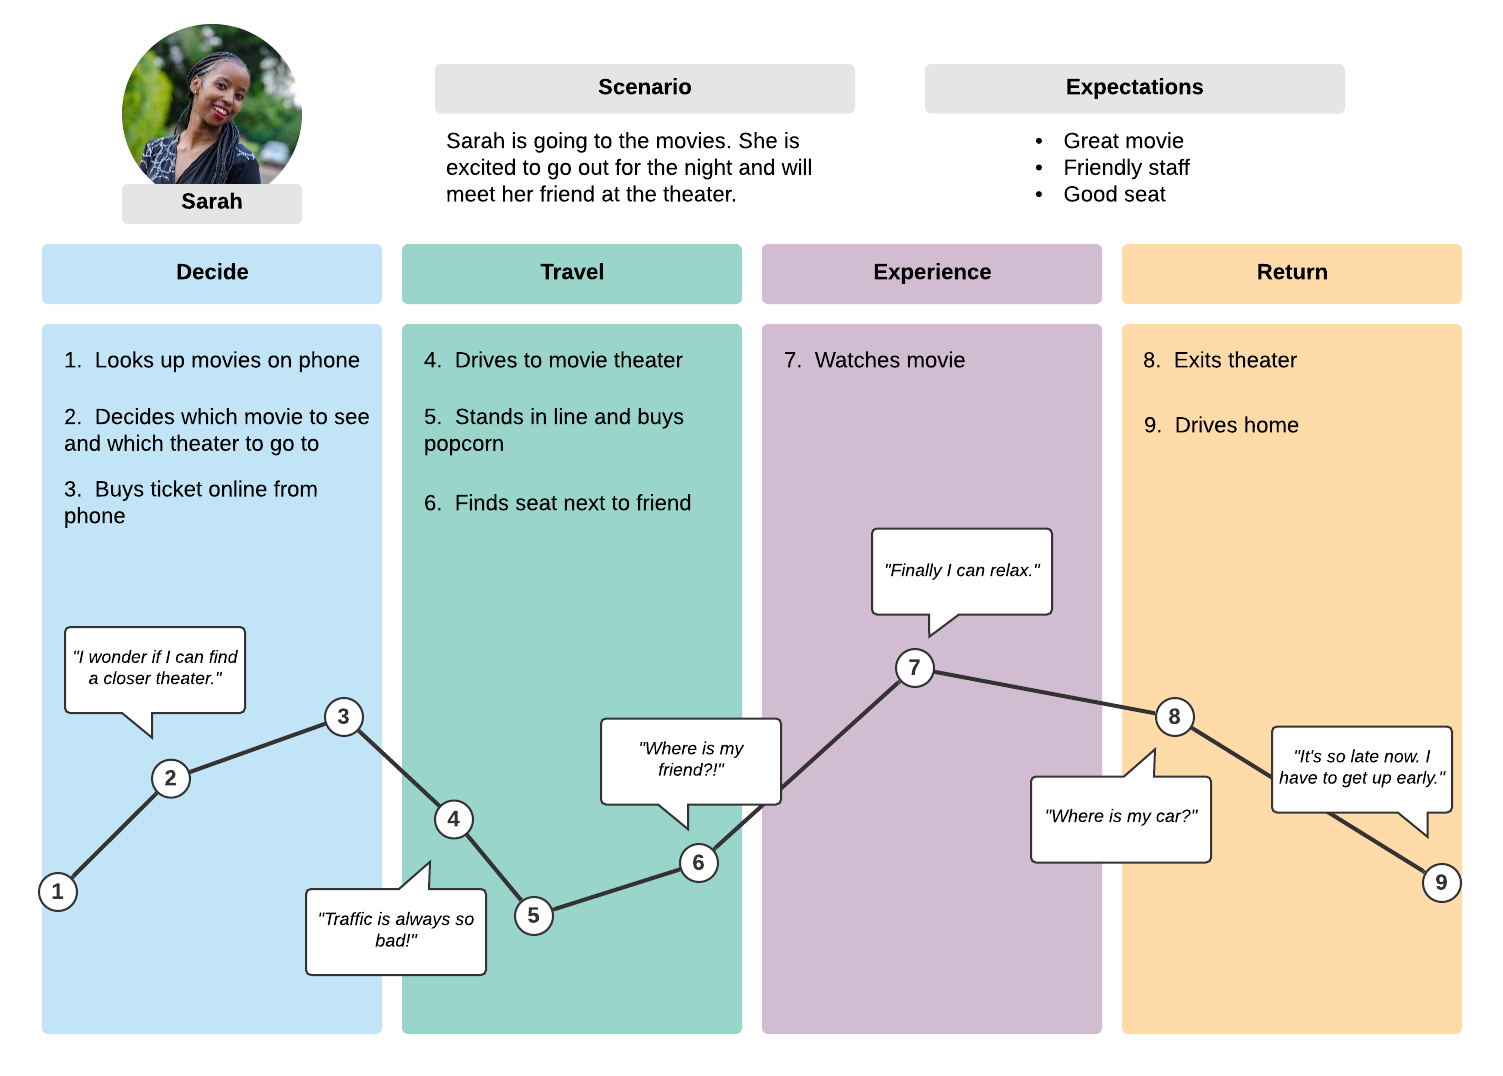
One of the most difficult parts of managing a crisis is planning and acting on a vision for the future. Visuals can help leaders and their employees visualize plans, map their strategy, and communicate clearly. 

In this article, we’ll walk you through the crisis management framework and how you can use visuals to drive efficiency, transparency, and collaboration during each phase. 

Using visuals during the Triage phase

The “Triage” phase is the beginning of the crisis when you are still in a highly reactionary phase. You are putting out fires and constantly getting inundated with new information. This uncertainty and chaos leads to cutting costs and adjusting operations to conserve cash and reduce costs.

How to use visuals

The Triage phase is chaotic, and you will likely be upending many of your regular operations and processes to adapt. Visuals like org charts, current state vs. future state diagrams, and process workflows can help you map where you are, where you need to be, and how your organization will operate in the meantime. 

Org charts are a simple but effective solution for understanding the structure of your business and how each role works together. Use org charts to map out your organization and hone in on high-priority roles, identify potential redundancies, and ensure all parts are working together.

Current state and future state diagrams outline your current and future processes and operations. In other words, they let you see where you are now and where you want to end up. 

current state vs future state flowchart

Comparing the two diagrams through as-is process analysis to identify what changes need to happen in order to reach that future state goal. This is an important tool during crisis management because you can more easily identify redundancies, inefficiencies, and gaps between your current processes and the future state of operations you’re trying to achieve.

Once you adapt your processes as needed, you can visualize your operations again in a new as-is diagram. Digitizing your new processes gets everyone up to speed on changes. Share your process diagrams with your stakeholders and employees so everyone is on the same page. Keeping your processes clear and transparent will ensure a smoother transition to new operating procedures through the crisis. 

Adapt your processes with the help of Lucidchart.

Learn how

Using visuals during the Doldrums phase

The “Doldrums” phase is the murky middle where you are past the initial panic of the crisis but haven’t yet started recovering. Cash flow may increase but overall improvements won’t be consistent. 

If the business has stabilized, this is the time to begin investing again and explore innovation—waiting to invest in the future at this point could put you behind your competitors when the crisis is over.

How to use visuals

The doldrums phase offers leaders an opportunity to get ahead of their competitors by investing early in a growth strategy. To do this successfully, you need to be able to identify the best opportunities for growth and map out how you will market to potential customers and clients.

Market research mind maps help marketers and business strategists brainstorm and outline their research process. The first step of the market research process is defining the problem (i.e., why you are conducting research). During this step, strategists decide what information they need, how they will use the information, and what methods they will use to collect the data. 

A mind map helps strategists and decision-makers plan out each piece of the research process including the purpose, methods, and phases of research. Clarifying the research process from the beginning ensures your research is effective and valuable for informing future campaigns.

Customer journey maps are another tool that helps marketers understand who they are marketing to and how audiences experience their brand. The customer journey map tells the story of your customers’ experiences with you from initial contact to purchase.

customer journey map example
Customer journey map example (Click on image to modify online)

Visualizing this journey is a great way to see all the ways customers interact with your brand and to identify potential points of friction or frustration. When you understand how your customers relate to you, you can develop strategies that deliver messaging when, where, and how they need it. 

When you meet potential customers where they are, you are more likely to convert them—which is crucial during times of uncertainty when resources are tight and every opportunity counts.

Using visuals during the Recovery phase

The recovery phase is when business starts to ramp up again. It is impossible to predict exactly when recovery will begin, but as the crisis passes, businesses and customers will begin to increase spending. Recovery is ideally when the investments you made during the doldrums phase start to pay off. Focus on expanding your customer base and building on those strategic investments. 

Business plans should evolve with the changing needs of your company and the ever-shifting market. In times of crisis, your plans almost certainly shifted to adapt. But how well did you communicate those changes? Communicating business changes clearly and promptly helps companies and their employees adapt more effectively and efficiently to new strategies and processes and ensures work is aligned across the organization. 

Keep everyone on the same page by visualizing your business plans and highlighting necessary changes. Visuals such as process flowcharts and org charts can illuminate key structural shifts and clarify individual and organizational processes. Change isn’t always easy, especially when emerging from a crisis, but good communication can make the transition smoother and more transparent for everyone.

Project cost estimation is an important part of the project manager’s tool belt and a key strategy for making smart decisions about resource allocation and investment. After a crisis, when, where, and how you spend your money (and other resources) is especially significant—inefficiencies and overspending during recovery can shutter your business before it has a chance to fully bounce back. 

There are several cost estimation methods. Depending on your preferred approach, take advantage of visuals like PERT charts and work breakdown structures to map your project costs, and identify factors that could impact final estimates. 

Even when we aren’t working through a significant crisis, we live in an uncertain world. Now, more than ever, businesses need to be agile in their processes and operations. Businesses who are able to prepare for and adapt to unexpected changes strategically will be better equipped to weather crises and thrive on the other end. 

Review these 8 signs that your company should adopt a new org structure.

Learn more

Lucidchart

Lucidchart, a cloud-based intelligent diagramming application, is a core component of Lucid Software's Visual Collaboration Suite. This intuitive, cloud-based solution empowers teams to collaborate in real-time to build flowcharts, mockups, UML diagrams, customer journey maps, and more. Lucidchart propels teams forward to build the future faster. Lucid is proud to serve top businesses around the world, including customers such as Google, GE, and NBC Universal, and 99% of the Fortune 500. Lucid partners with industry leaders, including Google, Atlassian, and Microsoft. Since its founding, Lucid has received numerous awards for its products, business, and workplace culture. For more information, visit lucidchart.com.

Bring your bright ideas to life.

Sign up free

or continue with

Sign in with GoogleSign inSign in with MicrosoftSign inSign in with SlackSign in

Get started

  • Pricing
  • Individual
  • Team
  • Enterprise
  • Contact sales
PrivacyLegal

© 2024 Lucid Software Inc.