fmea analysis

How to conduct an FMEA analysis: A step-by-step guide

Reading time: about 7 min

Topics:

  • Process improvement
  • Product development

Nobody likes to think about failure. But if you want to avoid it, you need to take a hard look at what could go wrong (and why), so you can take steps to reduce the risk.

That is the goal of the FMEA risk analysis.

Use the following step-by-step guide to learn how to conduct your own FMEA analysis to improve your business processes at every level.

FMEA flowchart example
FMEA flowchart example (click on image to modify online)

What is FMEA analysis?

FMEA stands for Failure Modes and Effects Analysis. It is a step-by-step method for identifying and analyzing all possible ways a process or product could fail and designing a strategy to prioritize and mitigate the biggest risks.   

In other words, FMEA asks and answers:

  • What could go wrong?
  • Why would the failure happen?
  • How likely is this failure?
  • What could be the consequences of each failure?

FMEA analysis helps you prevent issues by identifying them upfront. (Compare that to root cause analysis, which helps you determine what went wrong after an issue occurs). 

By evaluating your processes for risks, you can improve your systems and reduce the likelihood (and impact) of failure. This is important because discovering problems later on, especially in the middle of development or after implementation, can create costly delays and harm your client relationships.

FMEA is a proactive approach applied early in development to help designers create quality and reliable processes from the beginning.

When to use FMEA analysis

There are several cases when you should apply an FMEA analysis, including when:

  • Analyzing new designs or processes
  • Modifying an existing product design or process
  • Using a design or process in a new environment or application

FMEA can help you understand how a new design or proposed change will impact the system and uncover potential bottlenecks or unintended consequences before implementation. It’s also good practice to periodically conduct an FMEA analysis throughout the life of a service, product or process to ensure everything continues to run smoothly.

How to conduct an FMEA analysis

An FMEA analysis has three criteria for analyzing a problem:

  • The severity of the impact
  • The likelihood of occurrence
  • The probability the issue will be detected beforehand

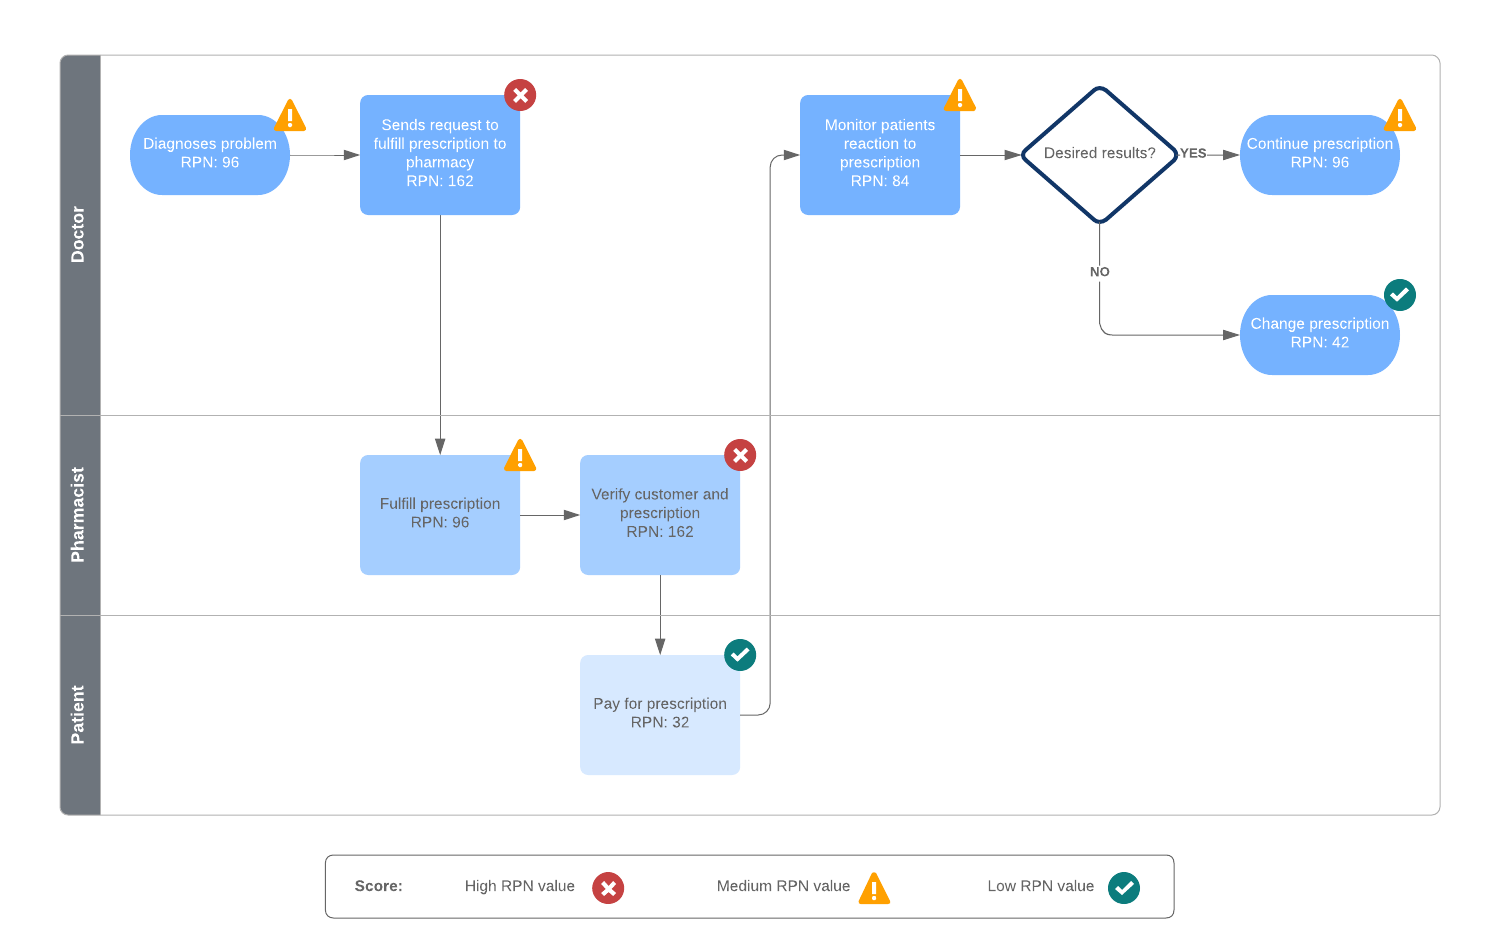
Each criterion is ranked between 1 and 10 and added together to calculate a risk priority number (RPN). The RPNs will help you identify and prioritize which issues to focus on first. The highest RPNs require immediate attention and a plan of action to mitigate their risks.

Here’s how to get started.

1. Choose a process you want to analyze

First, identify what product or process you want to assess. The FMEA analysis is comprehensive, so you want to focus on a specific process with a narrow scope. If you are already aware of an issue, that’s a good place to start.

Pro tip: For complex processes, consider breaking up the project into smaller parts and conducting multiple FMEA analyses.   

2. Gather a team

Next, put together a cross-functional team to help conduct a thorough analysis.

Team members should be people who are directly involved in the process you’re analyzing. They could come from design, manufacturing, maintenance, sales, or customer service. Include people who are not in management roles to get a clear perspective of the process realities (and challenges) on the ground.

3. Review the process

Review your current process and identify each process component and function. Be specific. Consider what the purpose of the process is and what customers expect it to do.

Map out your as-is process in Lucidchart to help you understand your current process flow and visualize areas with potential risks. Lucidchart operates in the cloud, which makes it easy to collaborate with your team members and make sure you haven’t missed any components.  

Once you have your process components mapped out, you can document them in your FMEA diagram.

4. Identify failure modes

Brainstorm all the different ways the process could break down. These are called failure modes. What are the risks? How could each component fail or malfunction?

Keep in mind that failure in one component could cause another failure somewhere else.

Pro Tip: Use sticky notes to list failures underneath each process step to more easily brainstorm and visualize the potential risks. 

5. Outline the effects of each potential failure

Once you’ve listed all the potential failure modes, go through each one and identify all the consequences on the system, process, customer, or organization.

In other words, for each failure mode, ask:

  • What happens when this function fails?
  • How does a failure here affect the customer?

Then consider what the root causes are for each failure (your team members are an invaluable resource here). List the causes on your FMEA diagram.

failure mode and effects analysis example
Failure mode and effects analysis Example (click on image to modify online)

6. Determine the severity of each failure

As noted earlier, FMEA ranks the three assessment criteria on a scale of 1 to 10. The first criterion is severity.

Go through each failure mode and assign it a number based on how serious the issue is, with 1 being insignificant and 10 being catastrophic. Add these rankings to the FMEA diagram.

7. Rank occurrence

Next, you will rank occurrence or the probability of each failure mode to occur. Again, assign a ranking between 1 and 10, with 1 being least likely and 10 being inevitable. Add these rankings to the FMEA table.  

8. Rank detection

The last criterion is detection. In other words, what is the likelihood the failure will be detected and acted upon before it happens (or before it is noticed by the customer)?

You’ll need to first identify what controls are currently in place to prevent the failure from happening or keeping the problem from reaching the customer.

Once you know what controls are in place, you can rank how likely those controls will prevent detection. Again, rank these probabilities for each failure on a scale of 1-10, with 1 meaning you're certain the failure will be detected and 10 meaning you're certain the failure will not be detected.  

9. Calculate the RPN

With each criterion ranked and listed on your FMEA table, you can multiply the rankings to calculate the risk priority number (RPN):

Severity x Occurrence x Detection = RPN

The RPN helps you prioritize which failures are most urgent so you can create a strategic plan of action.

10. Create a plan of action based on the risk priorities

With your failure modes mapped out and ranked, you can quickly assess which areas of the process need corrective measures and recommended actions. This might mean making changes to the process or product design or adjusting the measures and controls in place to mitigate risk and detection.

Your specific action plan should focus on the following objectives:

  • Eliminating failure modes from the process altogether where possible
  • Minimizing the severity and reducing the occurrence of failure modes
  • Improving detection of failure modes (i.e., improving controls)

As you map out your plans, note them on the FMEA sheet as well as which team members are responsible for each action.

After implementing these measures, note the results and recalculate the RPN to assess your progress and impact.

Using Lucidchart to map your FMEA

An FMEA diagram is a living document with multiple contributors. Lucidchart makes it easy for teams to share and update their process flowcharts and FMEA diagrams in real time so everyone is on the same page.

Swimlanes, color coding, and ready-made templates make it easy to see who is in charge of each step in the process.

As you implement changes, apply layers to the document to clearly show how and where your processes have changed so no one gets left behind.

flowchart

Get Lucidchart to document your action plan and move forward as a team.

Try for free

Lucidchart

Lucidchart, a cloud-based intelligent diagramming application, is a core component of Lucid Software's Visual Collaboration Suite. This intuitive, cloud-based solution empowers teams to collaborate in real-time to build flowcharts, mockups, UML diagrams, customer journey maps, and more. Lucidchart propels teams forward to build the future faster. Lucid is proud to serve top businesses around the world, including customers such as Google, GE, and NBC Universal, and 99% of the Fortune 500. Lucid partners with industry leaders, including Google, Atlassian, and Microsoft. Since its founding, Lucid has received numerous awards for its products, business, and workplace culture. For more information, visit lucidchart.com.

Related articles

Bring your bright ideas to life.

Sign up free

or continue with

Sign in with GoogleSign inSign in with MicrosoftSign inSign in with SlackSign in

Get started

  • Pricing
  • Individual
  • Team
  • Enterprise
  • Contact sales
PrivacyLegal

© 2024 Lucid Software Inc.