Data flow diagram

Data flow diagram examples, symbols, types, and tips

Reading time: about 7 min

Businesses are built on systems and processes—a company couldn’t operate without them. From lead nurturing methods to the way a team interacts with customers, nearly everything a business does involves a system of some sort. And, when it comes to systems and processes, efficiency is everything. In some cases, shaving even a minute or two off can lead to substantial savings over time. There are countless ways to analyze and improve efficiency, but one that stands out is through data flow diagrams. 

Data flow diagrams (DFDs) visually map your process or system, so you can uncover opportunities to improve efficiency and performance. Whether you are improving an existing process or implementing a new one, a data flow diagram will make the task easier. However, if you’ve never created a DFD before, getting started can be intimidating. There is a lot to take in: different levels of diagrams, symbols and notation, not to mention actually creating the diagram—navigating it all will take more than looking at a few examples. If you’re new to data flow diagrams, this guide will help get you started.

What is a data flow diagram?

A data flow diagram shows the way information flows through a process or system. It includes data inputs and outputs, data stores, and the various subprocesses the data moves through. DFDs are built using standardized symbols and notation to describe various entities and their relationships. 

Data flow diagrams visually represent systems and processes that would be hard to describe in just words. You can use these diagrams to map out an existing system and make it better or to plan out a new system for implementation. Visualizing each element makes it easy to identify inefficiencies and produce the best possible system. 

Read our full data flow diagrams overview to learn more about best practices when building DFDs.

Physical and logical data flow diagrams

Before actually creating your data flow diagram, you’ll need to determine whether a physical or logical DFD best suits your needs. If you’re new to data flow diagrams, don’t worry—the distinction is pretty straightforward.

Logical data flow diagrams focus on what happens in a particular information flow: what information is being transmitted, what entities are receiving that info, what general processes occur, etc. The processes described in a logical DFD are business activities—a logical DFD doesn’t delve into the technical aspects of a process or system, such as how the process is constructed and implemented. So you don’t need to include details like configuration or data storage technology. Non-technical employees should be able to understand these diagrams, making logical DFDs an excellent tool for communicating with project stakeholders.

logical data flow diagram
Logical Data Flow Diagram (Click on image to modify online)

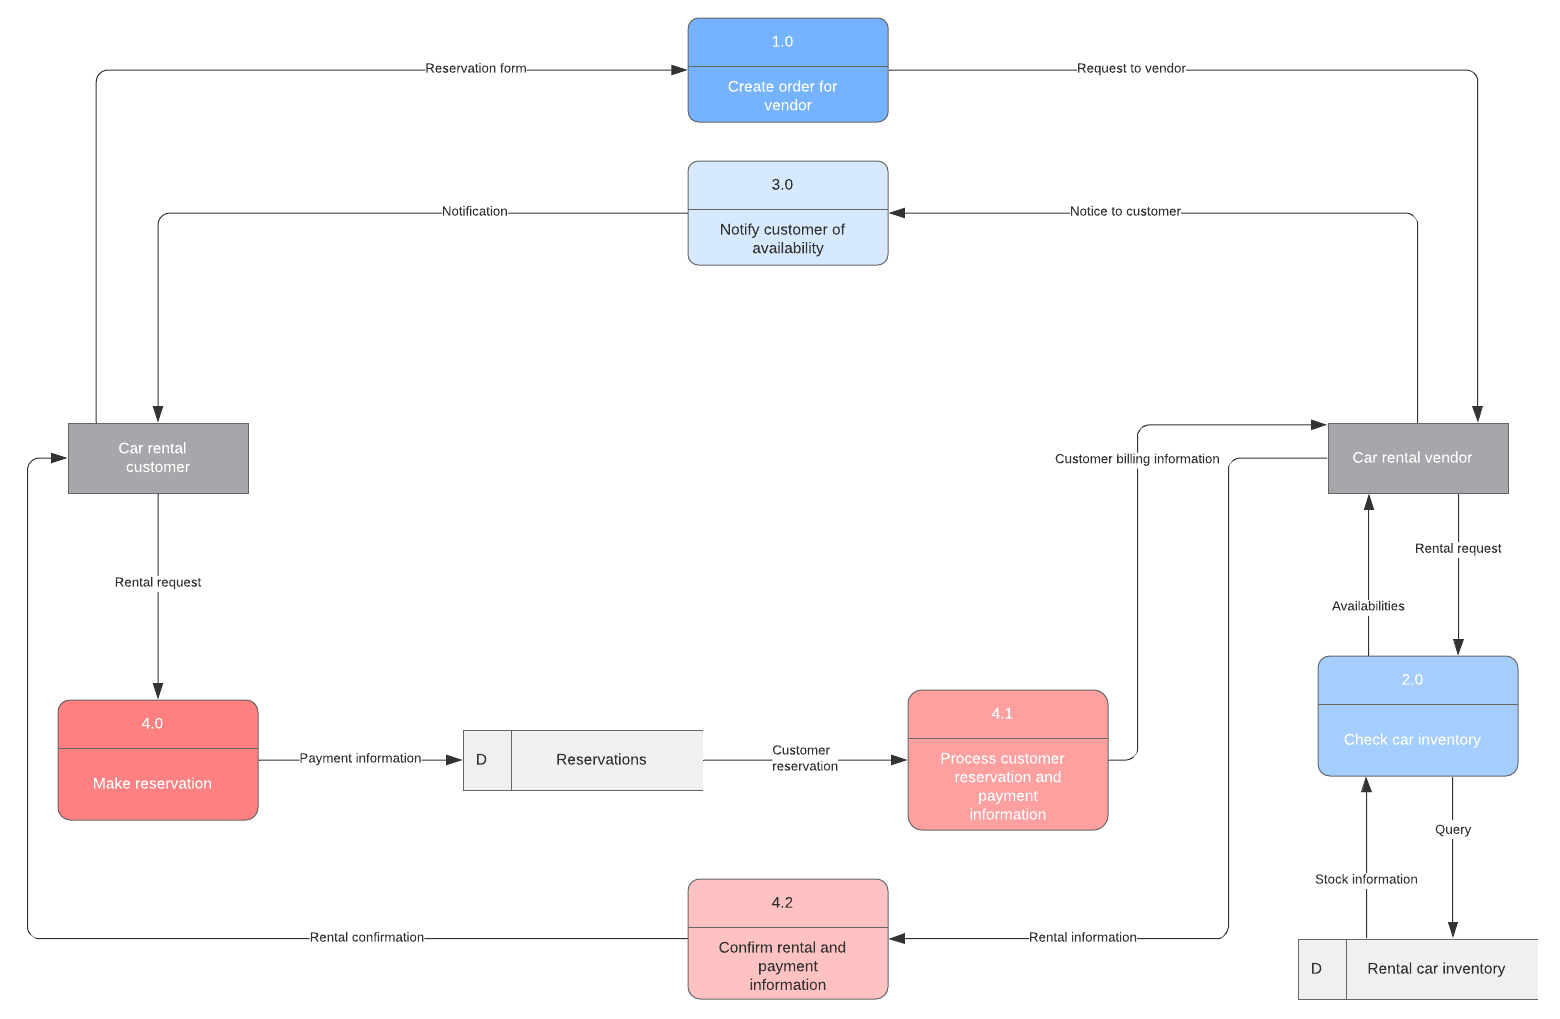
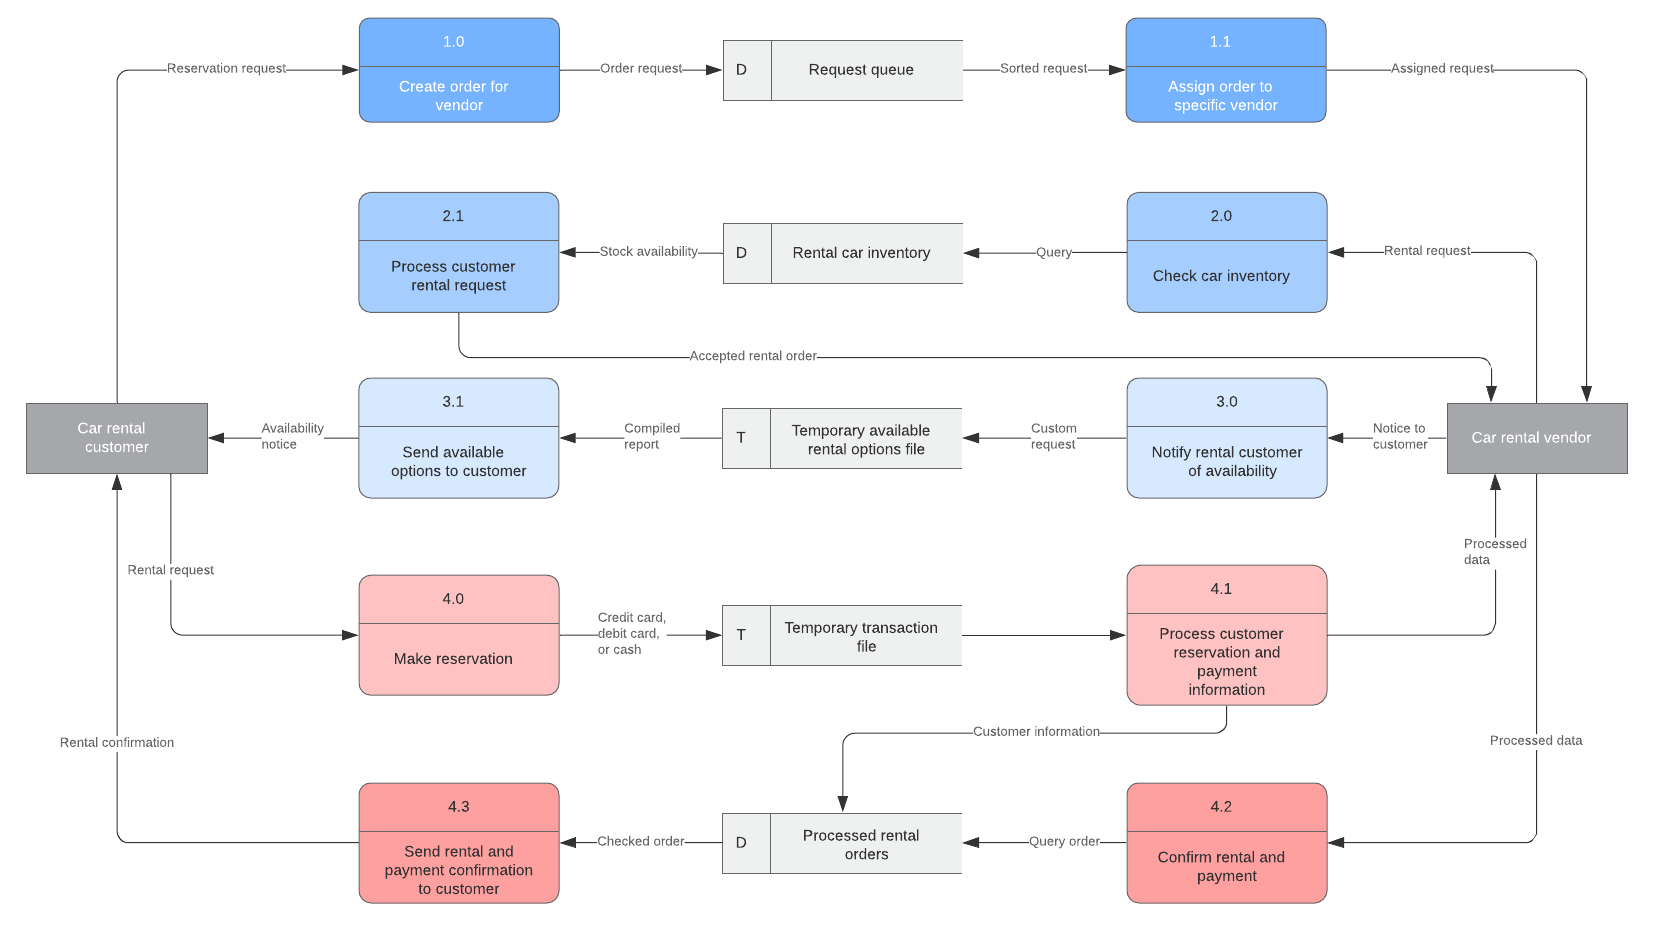
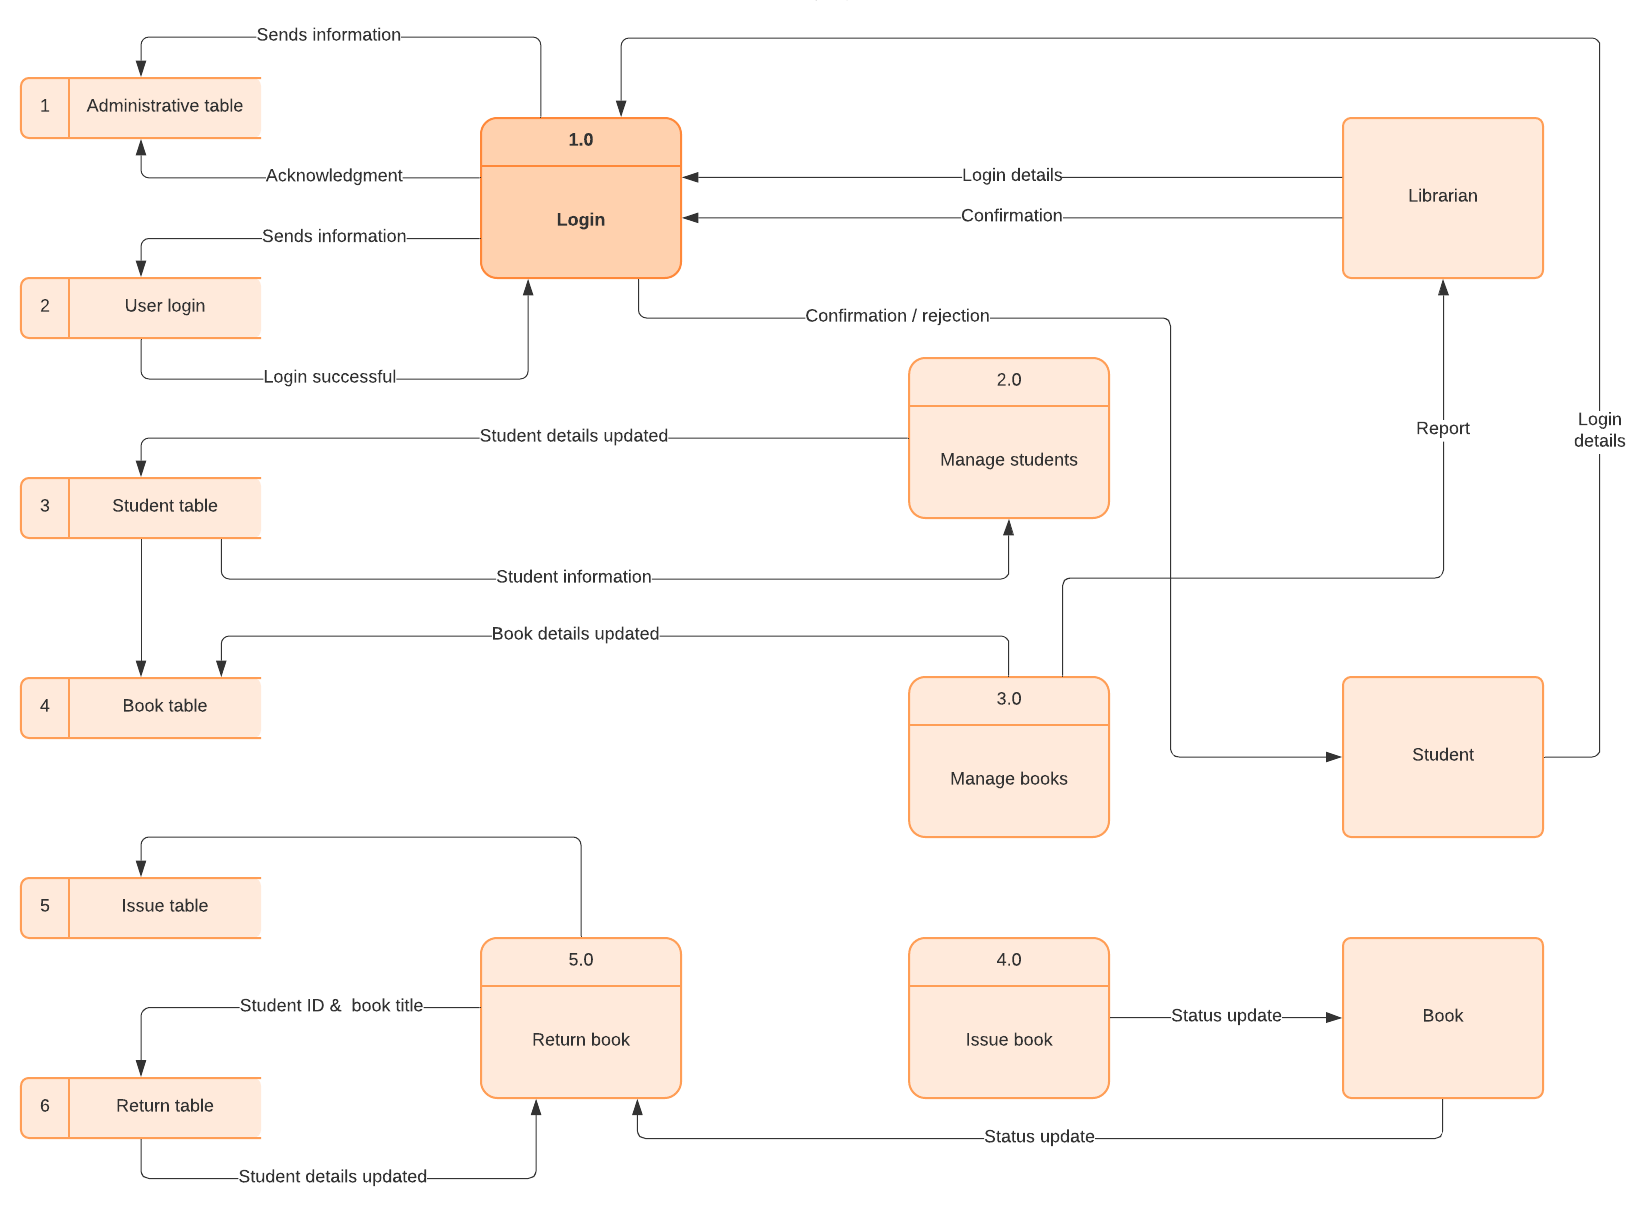
Physical data flow diagrams focus on how things happen in an information flow. These diagrams specify the software, hardware, files, and people involved in an information flow. A detailed physical data flow diagram can facilitate the development of the code needed to implement a data system. 

physical data flow diagram
Physical Data Flow Diagram (Click on image to modify online)

Both physical and logical data flow diagrams can describe the same information flow. In coordination they provide more detail than either diagram would independently. As you decide which to use, keep in mind that you may need both. 

Check out this guide to physical and logical DFDs for more information.

Data flow diagram levels

Data flow diagrams are also categorized by level. Starting with the most basic, level 0, DFDs get increasingly complex as the level increases. As you build your own data flow diagram, you will need to decide which level your diagram will be. 

Level 0 DFDs, also known as context diagrams, are the most basic data flow diagrams. They provide a broad view that is easily digestible but offers little detail. Level 0 data flow diagrams show a single process node and its connections to external entities. For instance, the example shown below illustrates the hotel reservation process with the flow of information between admin and guests.  

data flow diagram level 0
Data Flow Diagram Level 0 Template (Click on image to modify online)

Level 1 DFDs are still a general overview, but they go into more detail than a context diagram. In level 1 DFD, the single process node from the context diagram is broken down into sub-processes. As these processes are added, the diagram will need additional data flows and data stores to link them together. In the hotel reservation example, this can include adding the room selection and inquiry processes to the reservation system, as well as data stores. 

data flow diagram level 1
Data Flow Diagram Level 1 Template (Click on image to modify online)

Level 2+ DFDs simply break processes down into more detailed sub-processes. In theory, DFDs could go beyond level 3, but they rarely do. Level 3 data flow diagrams are detailed enough that it doesn’t usually make sense to break them down further. 

The level 2 diagram below expands on the hotel reservation process to include more granular processes involved, such as the cancellation and confirmation processes and subsequent connected data flows.

data flow diagram level 2
Data Flow Diagram Level 2 Template (Click on image to modify online)

Data flow diagram symbols and notation

Depending on the methodology (Gane and Sarson vs. Yourdon and Coad), DFD symbols vary slightly. However, the basic ideas remain the same. There are four basic elements of a data flow diagram: processes, data stores, external entities, and data flows. The picture below shows the standard shapes for both methodologies.

If you’re unsure how to use each symbol, read our DFD symbols guide.

How to create a data flow diagram

Now that you have some background knowledge on data flow diagrams and how they are categorized, you’re ready to build your own DFD. The process can be broken down into 5 steps:

1. Identify major inputs and outputs in your system 

Nearly every process or system begins with input from an external entity and ends with the output of data to another entity or database. Identifying such inputs and outputs gives a macro view of your system—it shows the broadest tasks the system should achieve. The rest of your DFD will be built on these elements, so it is crucial to know them early on.

2. Build a context diagram

Once you’ve identified the major inputs and outputs, building a context diagram is simple. Draw a single process node and connect it to related external entities. This node represents the most general process that information follows to go from input to output. 

The data diagram flow example below shows how information flows between various entities via an online community. Data flows to and from the external entities, representing both input and output. The center node, “online community,” is the general process. 

3. Expand the context diagram into a level 1 DFD

The single process node of your context diagram doesn’t provide much information—you need to break it down into sub-processes. In your level 1 data flow diagram, you should include several process nodes, major databases, and all external entities. Walk through the flow of information: where does the information start and what needs to happen to it before each data store?

4. Expand to a level 2+ DFD

To enhance the detail of your data flow diagram, follow the same process as in step 3. The processes in your level 1 DFD can be broken down into more specific sub-processes. Once again, ensure you add any necessary data stores and flows—at this point, you should have a fairly detailed breakdown of your system. To progress beyond a level 2 data flow diagram, simply repeat this process. Stop once you’ve reached a satisfactory level of detail.

5. Confirm the accuracy of your final diagram

When your diagram is completely drawn, walk through it. Pay close attention to the flow of information: does it make sense? Are all necessary data stores included? By looking at your final diagram, other parties should be able to understand the way your system functions. Before presenting your final diagram, check with co-workers to ensure your diagram is comprehensible.

data flow diagram example
Data Flow Diagram Example (Click on image to modify online)

Sharing your data flow diagram

After completing your DFD, the next step is sharing it. You didn’t create it just to keep to yourself—whether it’s team members, your boss, or stakeholders, chances are somebody else needs to see it. If you use Lucidchart to create a data flow diagram, you’ll have a variety of sharing options at your disposal. Diagrams can be sent directly within Lucidchart, giving the recipient access to the Lucidchart document. Depending on the recipient’s role, you can give them permission to edit or send the diagram as view only. Lucidchart’s extensive integrations allow for diagram sharing across several other platforms including Google Workspace and Slack. 

Get started with our data flow diagram software.

Learn more

Lucidchart

Lucidchart, a cloud-based intelligent diagramming application, is a core component of Lucid Software's Visual Collaboration Suite. This intuitive, cloud-based solution empowers teams to collaborate in real-time to build flowcharts, mockups, UML diagrams, customer journey maps, and more. Lucidchart propels teams forward to build the future faster. Lucid is proud to serve top businesses around the world, including customers such as Google, GE, and NBC Universal, and 99% of the Fortune 500. Lucid partners with industry leaders, including Google, Atlassian, and Microsoft. Since its founding, Lucid has received numerous awards for its products, business, and workplace culture. For more information, visit lucidchart.com.

Related articles

Bring your bright ideas to life.

Sign up free

or continue with

Sign in with GoogleSign inSign in with MicrosoftSign inSign in with SlackSign in

Get started

  • Pricing
  • Individual
  • Team
  • Enterprise
  • Contact sales
PrivacyLegal

© 2024 Lucid Software Inc.