visual project management

Tips and tools for visual project management

Reading time: about 7 min

Topics:

  • Project management

From an early age, we learn to categorize the world around us through visuals. Think about the way we learn to maneuver through traffic based on the colors of traffic lights or the way we identify our teammates by the colors on their jerseys. Visuals allow us to express complex ideas in a simplified format, saving precious time and valuable resources.

So in the workplace, as team members constantly fine-tune the ways they work alongside one another and strive for better efficiency, it might be time to take advantage of our natural tendency toward visuals. 

Visual project management implements visuals into work processes so everyone clearly understands their role and responsibilities in bringing an idea to life. Instead of retrieving multiple emails, compiling elaborate directions, and writing down countless updates, your team can simplify through flowcharts, timelines, visual planning boards, and similar tools.

Learn the science behind visual communication, plus three visual project planning tools that will help ensure that your projects are completed on time, on budget, and with the quality you expect.

project timeline example
Project Timeline Example (Click on image to modify online)

The science of visual communication

Some critics of visual project management have tried to argue the merits of taking the time to write out as much information as possible as a way of being thorough. But is visual project management a lazy man’s technique? Science seems to point towards “no.” 

According to psychologist Albert Mehrabian, symbols communicate information to us more quickly because of our brain’s ability to process multiple symbols at once, as opposed to the sequential processing of written language. Not only is symbolized information absorbed more quickly, but it is also retained more easily, with as high as 80% retention of image-related information in most people, as opposed to 10% retention with audio information and 20% retention in written information. 

Can you think of a time where visuals have affected your behavior? For example, has a handicapped symbol stopped you from parking in a particular spot or have you decided to get your car inspected after seeing a warning symbol light up on your dashboard? As consumers, we can even notice how app developers design notifications in bright colors like red, orange, or light blue, drawing our eyes to information that they deem important or memorable. 

Research estimates that visuals are processed 60,000 times faster than text. Visual project management takes advantage of this phenomenon and applies the way our brains operate naturally in order to engage processes that move your tasks and collaboration forward. 

3 types of visual project management tools 

Depending on the type of project at hand, project managers may choose from a variety of visual project management tools and techniques. Get started with these options.

Kanban board

A Kanban board is a visual task manager that illustrates a project at different stages in the process by using cards to depict work tasks and columns to depict each stage in the process (e.g., “to do,” “doing,” and “done”). The Kanban methodology functions by managing and monitoring works-in-progress.

kanban board example
Kanban Board Example (Click on image to modify online)

Best uses: If your project involves a collection of similar smaller tasks, like writing individual articles to be compiled for a larger story, the Kanban board works great. It allows you to visualize where each task is in the process and switch things up as you go if you decide on a better workflow. Magazine editors, sales managers, and software developers all find Kanban useful.

Pros

  • The Kanban methodology is very simple to learn and implement.
  • It provides more flexibility because it doesn’t have set roles or a set methodology.
  • Kanban allows for change at any point—it doesn’t give a set timeframe to complete tasks, so Kanban boards account for longer projects and team members can pull new tasks from the backlog at any time.

Cons

  • Kanban boards can become convoluted if they have too many tasks. The methodology advises that teams agree on a maximum number of tasks that can be in progress at the same time.
  • Flexibility can work against the end goal because there are no rigid timeframes. 

Scrum board

A scrum board differs from a kanban board in that scrum boards track work in sprints. A sprint is a length of time that is long enough to allow tasks to be completed, but short enough that teammates can focus on one or a small number of tasks at a time, requiring that tasks be completed on a fixed time scale. The scrum process is facilitated by a scrum master.

scrum board example
Scrum Board Example (Click on image to modify online)

Best uses: If the goal is to deliver a product, scrum methodology is a great choice because it focuses the efforts of an entire team during a given timeframe. Scrum boards are a favorite visual project management tool for software companies, event planners, filmmakers, design firms, and even militaries. 

Pros

  • Scrum boards increase team accountability.
  • The scrum methodology requires teams to work in two-week sprints, which can lead to deeper focus and higher productivity.
  • Scrum methodology has a set process for reporting and reviewing each sprint, so your team can continually improve.

Cons

  • Scrum follows a specific methodology, so it might be more difficult to implement for those who aren’t already experienced in that style.
  • Scrum boards are less flexible—you can’t add tasks mid-sprint, and each team member is expected to complete their work within two weeks.

See a complete breakdown of scrum boards vs kanban boards.

Gantt chart

A Gantt chart is a bar chart that visually demonstrates a project schedule, illustrating overlapping deadlines and even dependency between different project tasks. As a visual task management tool, it involves first identifying essential tasks, then indicating task relationships, and finally charting their progress.

basic Gantt chart
Basic Gantt Chart (Click on image to modify according to your project's history)

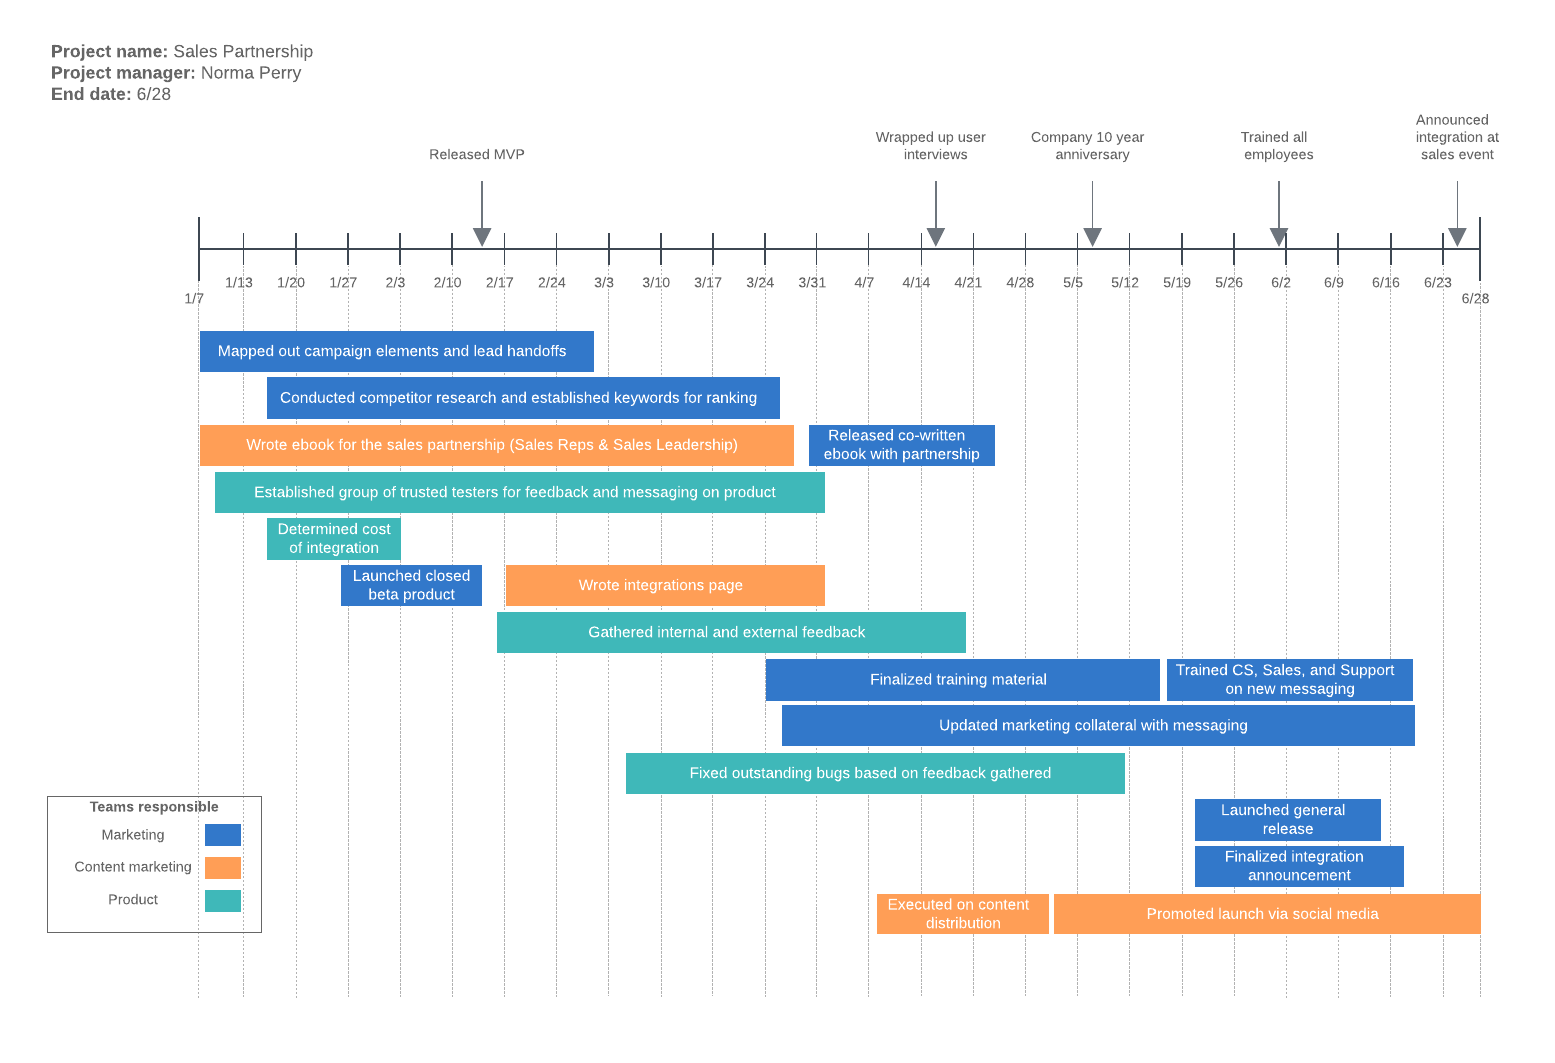
Best uses: Engineering firms, movie studios, and political campaign managers have been known to benefit greatly from Gantt charts, as they have a variety of simultaneously running tasks that all depend on one another to achieve an end goal. If your projects are more complex with overlapping timelines, Gantt charts are a great option for visual project planning and time management.

Pros

  • Gantt charts can help you set reasonable timeframes, and they give a good forecast of when the entire project will be completed.
  • Gantt charts allow teammates and project leaders to see the dependency relationship between tasks, making timelines more manageable.

Cons

  • Because Gantt charts organize when tasks occur, when tasks are due, which team members are assigned to certain tasks, and which tasks are dependent on others, they can become complicated quickly. They are also difficult to build without the right tools.
  • Since tasks are dependent on each other, with strict deadlines, Gantt charts have been known to be inflexible.

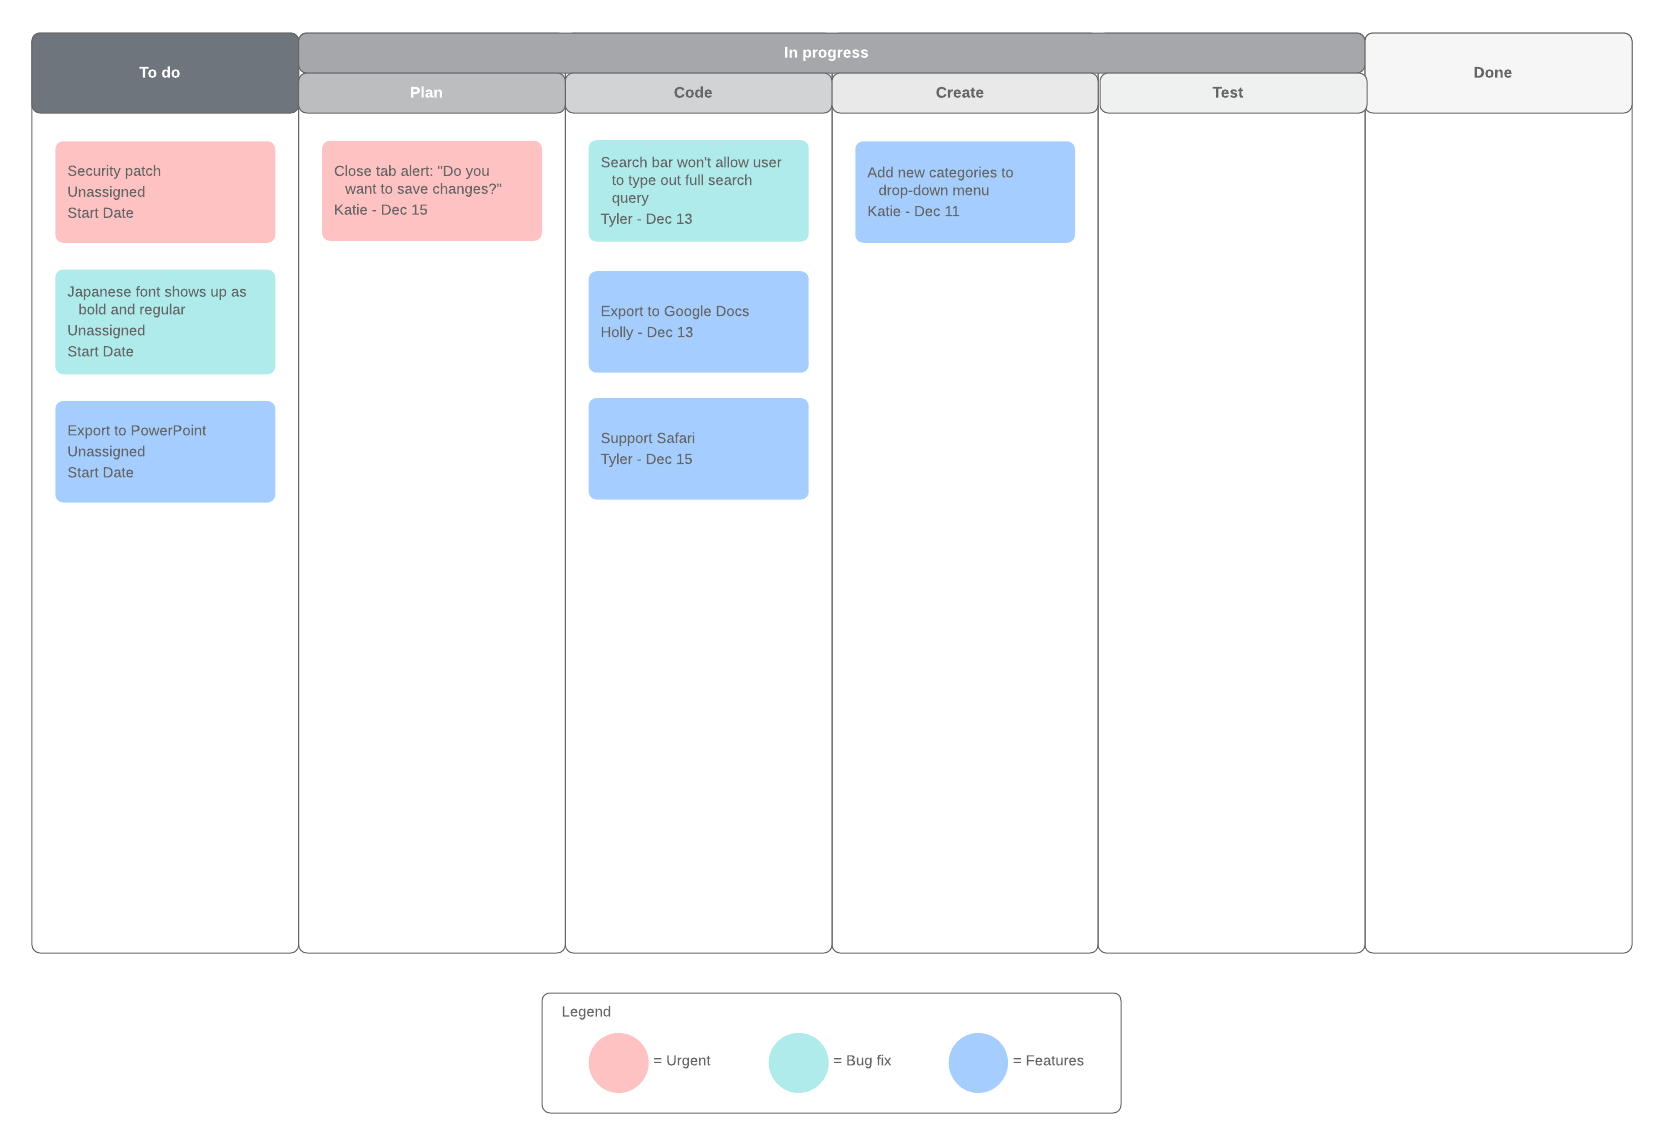
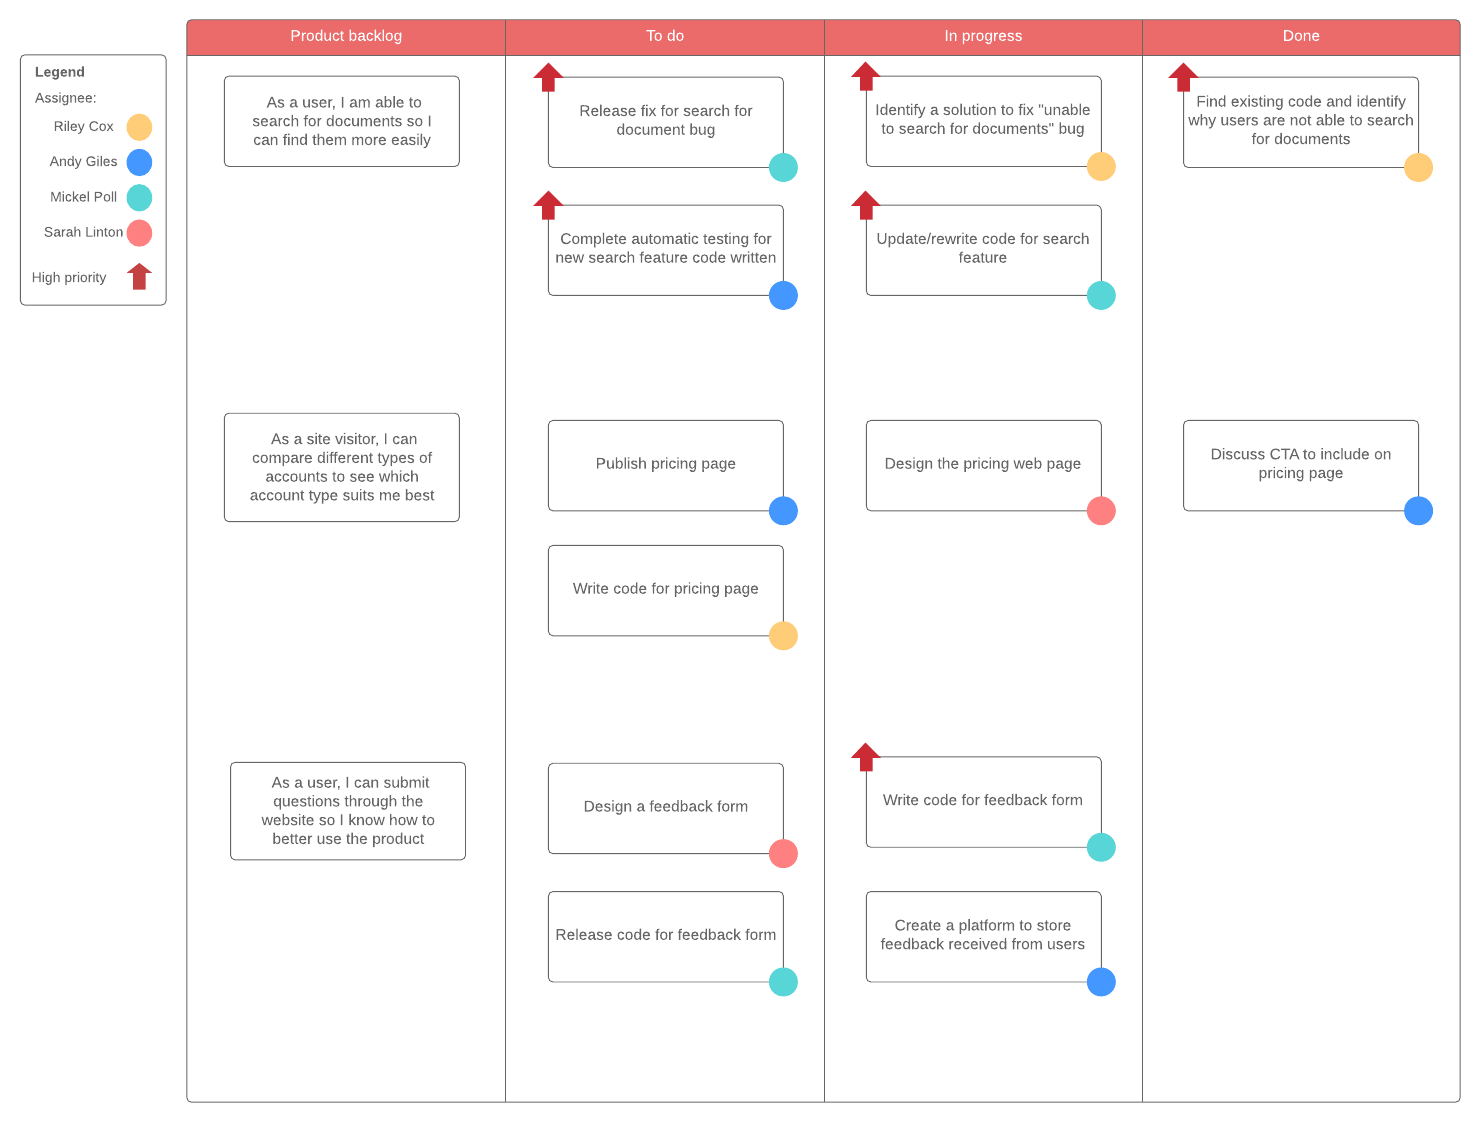
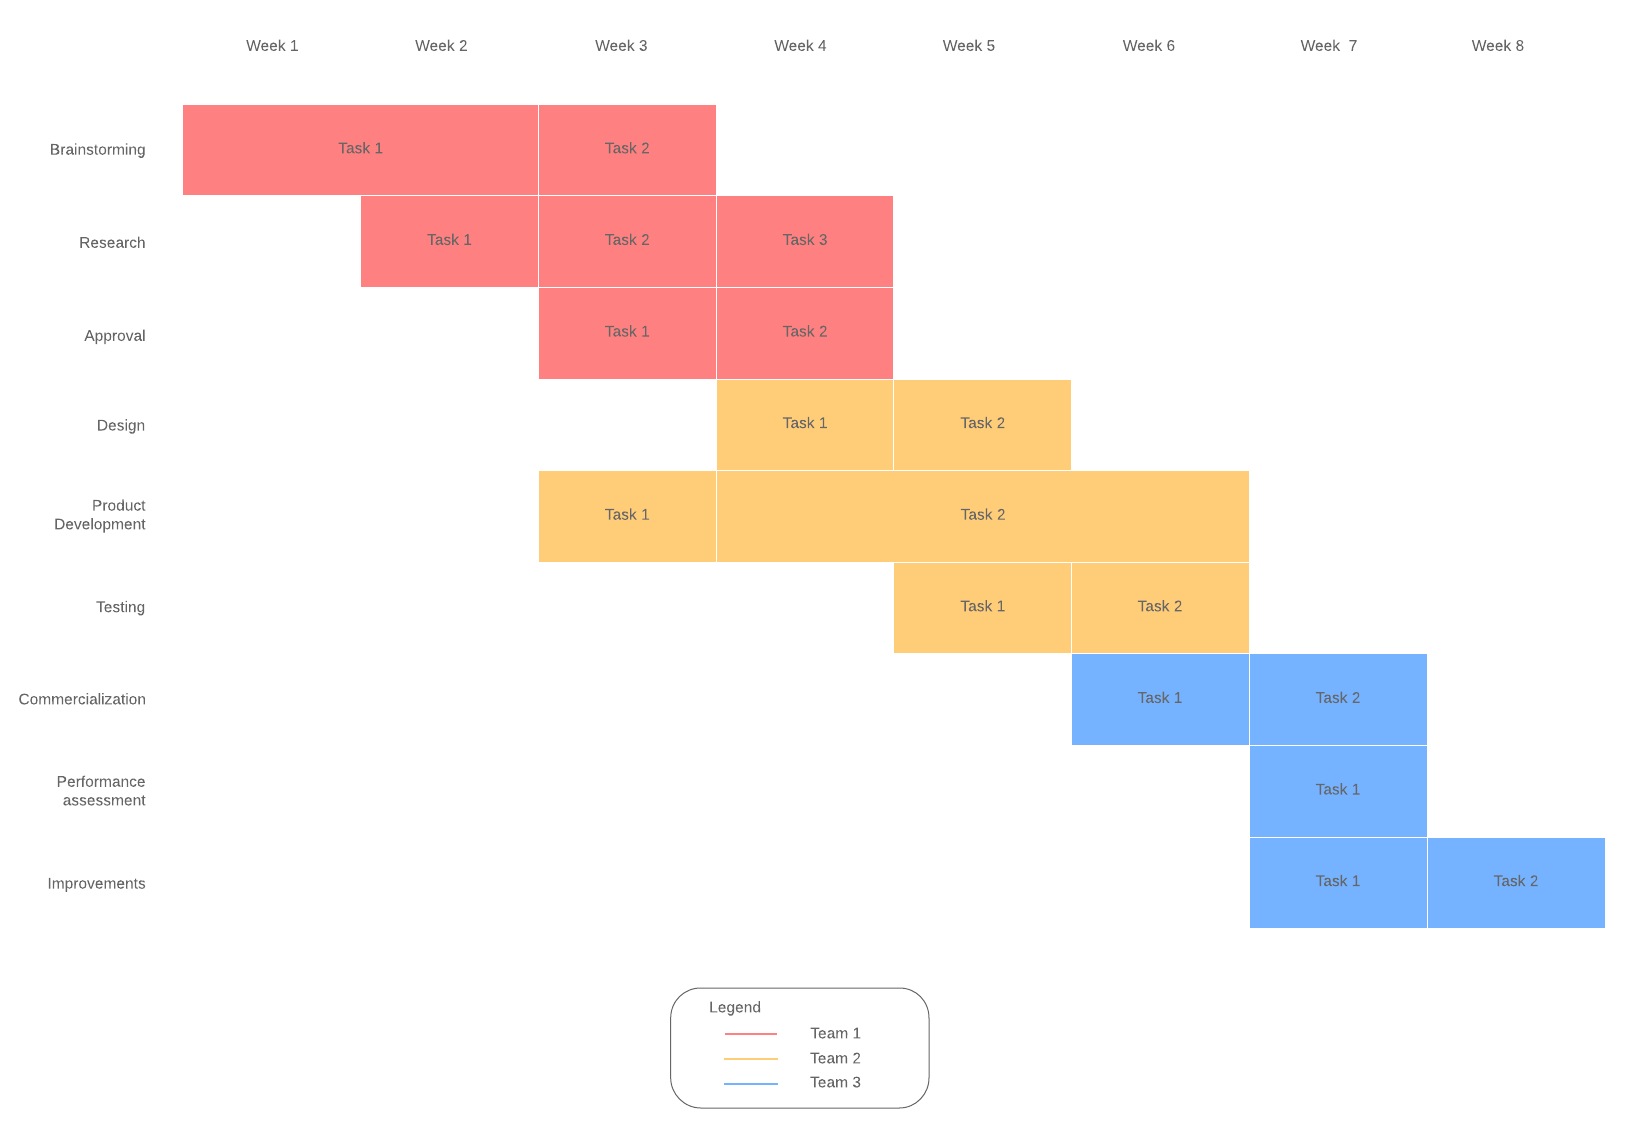
A lot of project managers feel intimidated by Gantt charts, but you can reap the same benefits with these Gantt chart alternatives.

Benefits of visual time management and project planning

Project management is a necessary skill for any professional, and visual project planning comes with various advantages, including:

  • Speed: Visual project management saves lots of time by giving teammates the ability to understand project progress at a glance, rather than reading lengthy project briefs and updates.
  • Convenience: Effective visual project management will improve communication by eliminating the need for lengthy emails or explanations.
  • Clarity: Visual project management clearly shows the progress of a task or project, giving project managers and teammates the ability to quickly identify whether each piece of the project is on time or falling behind.
  • Transparency: Because the goal of visual project management is to give a bird’s eye view of the project and its progress, it can be a powerful collaboration tool when everyone can see what everyone else is working on. 

It’s about teamwork—and how your team works

Collaboration is the cornerstone to any successful team endeavor. Teams who are able to communicate effectively and collaborate efficiently have an immense advantage over teams with poor communication and inefficient processes. Visual project management is a method by which your teammates can visualize processes, understand one another’s roles and how each role affects the others, and anticipate timelines.

The key benefit to visual task management is the ability to condense large amounts of information or communications into simple, and often aesthetic, visual representations.

Finding the right solution for you

As an industry leader in diagramming software, Lucidchart is an unbeatable partner in visual project management. From Kanban boards to scrum boards, Gantt charts, and timelines, the versatile templates provided by Lucidchart will facilitate better project management and help your company innovate faster. Try Lucidchart today.

Lucidchart

Lucidchart, a cloud-based intelligent diagramming application, is a core component of Lucid Software's Visual Collaboration Suite. This intuitive, cloud-based solution empowers teams to collaborate in real-time to build flowcharts, mockups, UML diagrams, customer journey maps, and more. Lucidchart propels teams forward to build the future faster. Lucid is proud to serve top businesses around the world, including customers such as Google, GE, and NBC Universal, and 99% of the Fortune 500. Lucid partners with industry leaders, including Google, Atlassian, and Microsoft. Since its founding, Lucid has received numerous awards for its products, business, and workplace culture. For more information, visit lucidchart.com.

Related articles

Bring your bright ideas to life.

Sign up free

or continue with

Sign in with GoogleSign inSign in with MicrosoftSign inSign in with SlackSign in

Get started

  • Pricing
  • Individual
  • Team
  • Enterprise
  • Contact sales
PrivacyLegal
  • linkedin
  • twitter
  • instagram
  • facebook
  • youtube
  • glassdoor
  • tiktok

© 2024 Lucid Software Inc.