About Lucidchart
Lucidchart, a cloud-based intelligent diagramming application, is a core component of Lucid Software's Visual Collaboration Suite. This intuitive, cloud-based solution empowers teams to collaborate in real-time to build flowcharts, mockups, UML diagrams, customer journey maps, and more. Lucidchart propels teams forward to build the future faster. Lucid is proud to serve top businesses around the world, including customers such as Google, GE, and NBC Universal, and 99% of the Fortune 500. Lucid partners with industry leaders, including Google, Atlassian, and Microsoft. Since its founding, Lucid has received numerous awards for its products, business, and workplace culture. For more information, visit lucidchart.com.
Related articles
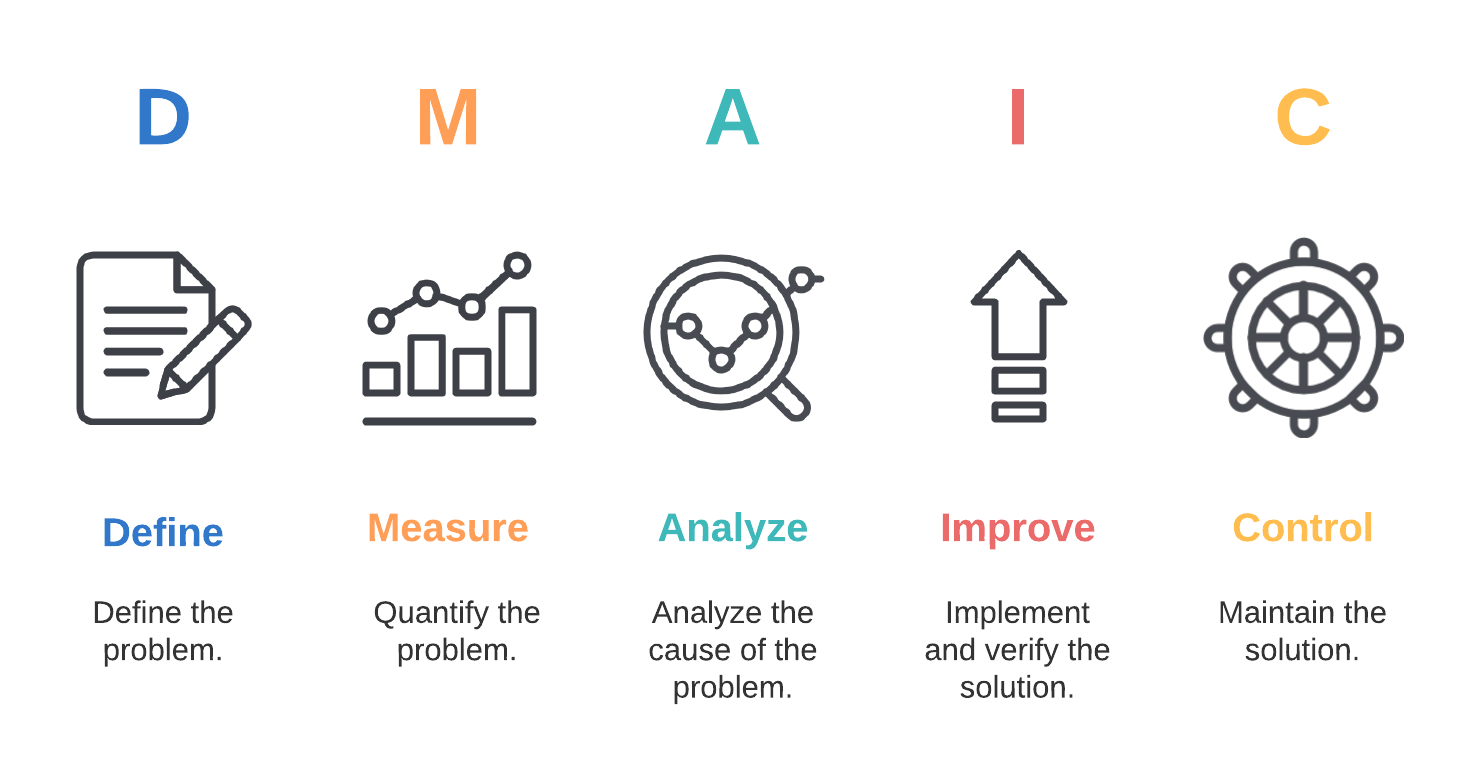
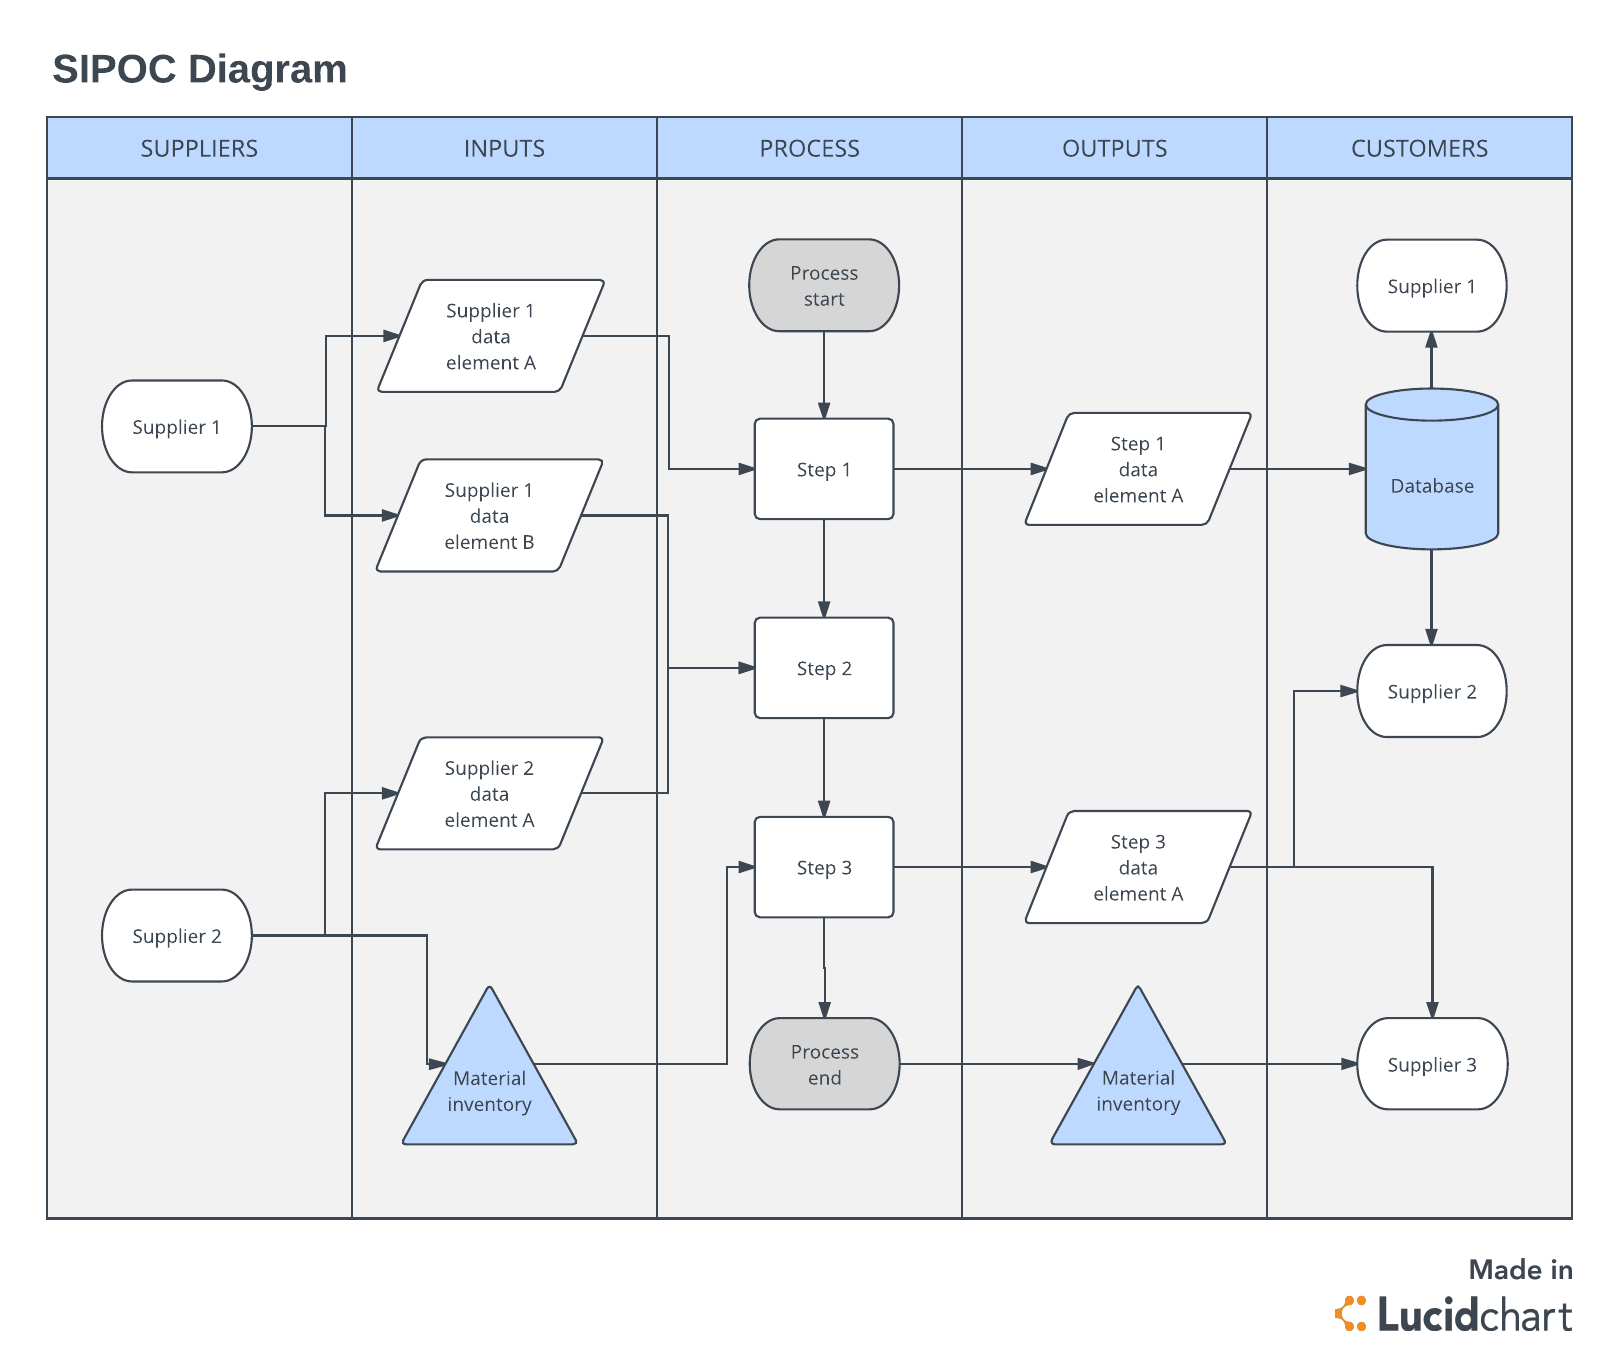
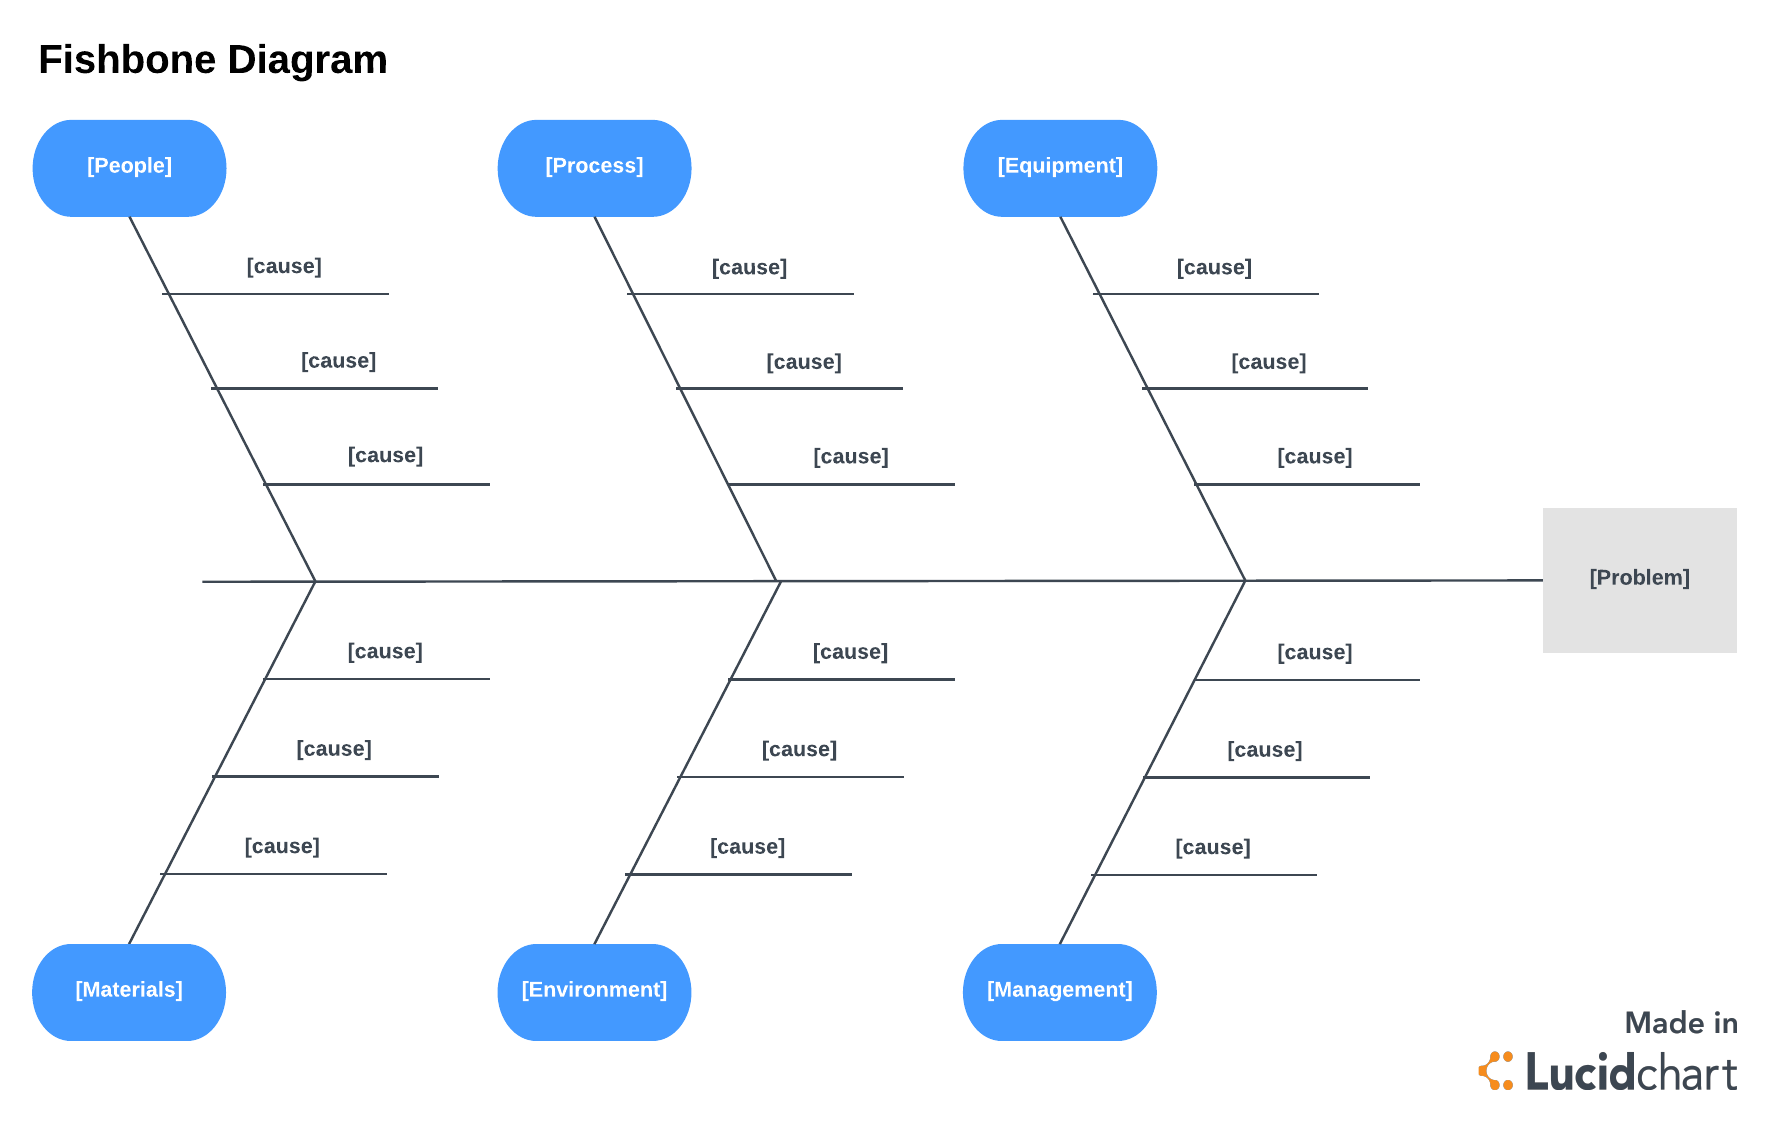
Six Sigma process mapping: Why it matters and how to get started
Learn everything you need to know about Six Sigma process mapping, including benefits, step-by-step instructions, and different types of process maps you can use.
Why Choose Six Sigma Methodology for Project Management
Learn the fundamentals of applying Six Sigma methodology to your project management, and take advantage of some free resources to get you started.
Bring your bright ideas to life.


By registering, you agree to our Terms of Service and you acknowledge that you have read and understand our Privacy Policy.