improve process efficiency

How to (really) improve process efficiency

Reading time: about 6 min

Topics:

  • Process improvement

Your business relies on meeting quotas and benchmarks to thrive, but knowing what the end goal is and knowing how to get there most efficiently isn’t easy without the proper guidance.

In fact, without truly improving your company’s process efficiency, your bottom line could face irreparable damage, and your employees (not to mention your customers) could become fed up with the way your business operates. Evaluating the processes existing within your company and then tracking them, improving them, and measuring their success is vital to any business.

In this article, we’ll explain what process efficiency is, show you why it’s so important to maximize, and then teach you how to become the process efficiency master of the universe.

What is process efficiency?

The definition of process efficiency is essentially “the amount of effort or input required to produce your business’s product.”

For instance, if it takes 300 workers to make a single pack of gum, your process efficiency is abysmal. And you should get out of the gum manufacturing business. But if you have 300 workers and they’re producing 150,000 packs of gum a day, you most likely have a business supported by efficient processes.

How do I measure process cycle efficiency?

To measure efficiency, you can use this process cycle efficiency formula:

value-added time/total lead time

Value-added time refers to the time spent actually creating your product. Total lead time refers to the time it takes to complete the entire process cycle, which includes both value-added time and wasted time (such as waiting for the next step). According to Lean manufacturing standards, value-added time should make up more than 25% of your process.

Businesses have also used this formula to determine overall process efficiency:

(value of outputs/value of inputs) x 100

Typically, the value will be a dollar amount. For example, say your company spends $500,000 a day to pay for the labor and materials required to manufacture chewing gum, and your company produces $750,000 worth of gum daily. Your company would be operating at 150% efficiency.

A process that is over 100% is considered to add value. The higher the percentage, the most efficient your processes are.

Other process efficiency metrics

These calculations are not the only measures of success that may be relevant to your business. For instance, you may be producing a lot of bubblegum, but one out of every 10 pieces is not the appropriate size. That’s when you need to look at other types of process efficiency metrics, such as:

  • Resource efficiency
  • Capacity (i.e., the amount that can be produced within a specific timeframe)
  • Labor productivity
  • Throughput (i.e., the output of a process or machine for a unit of time)
  • Resource efficiency
  • Turnaround time
  • Profitability (i.e., the relationship between total sales and profit)
  • Quality (i.e., the number of outputs that are acceptable for use or free of defects)
  • Return on investment

Your business has dozens of processes, both complex and simple. By examining all the processes in your company to determine where efficiency could be optimized (or analyzing other process efficiency metrics, depending on your goals), you can save you money while saving your employees’ sanity.

How to streamline processes

Now armed with a process efficiency definition and different formulas and metrics you can use, it’s time to examine each step in every process and eliminate (or significantly lessen) waste, redundancy, errors, and delays to maximize the work you and your employees do.

As you try to improve process efficiency, make sure to follow these steps.

1. Map out your existing processes

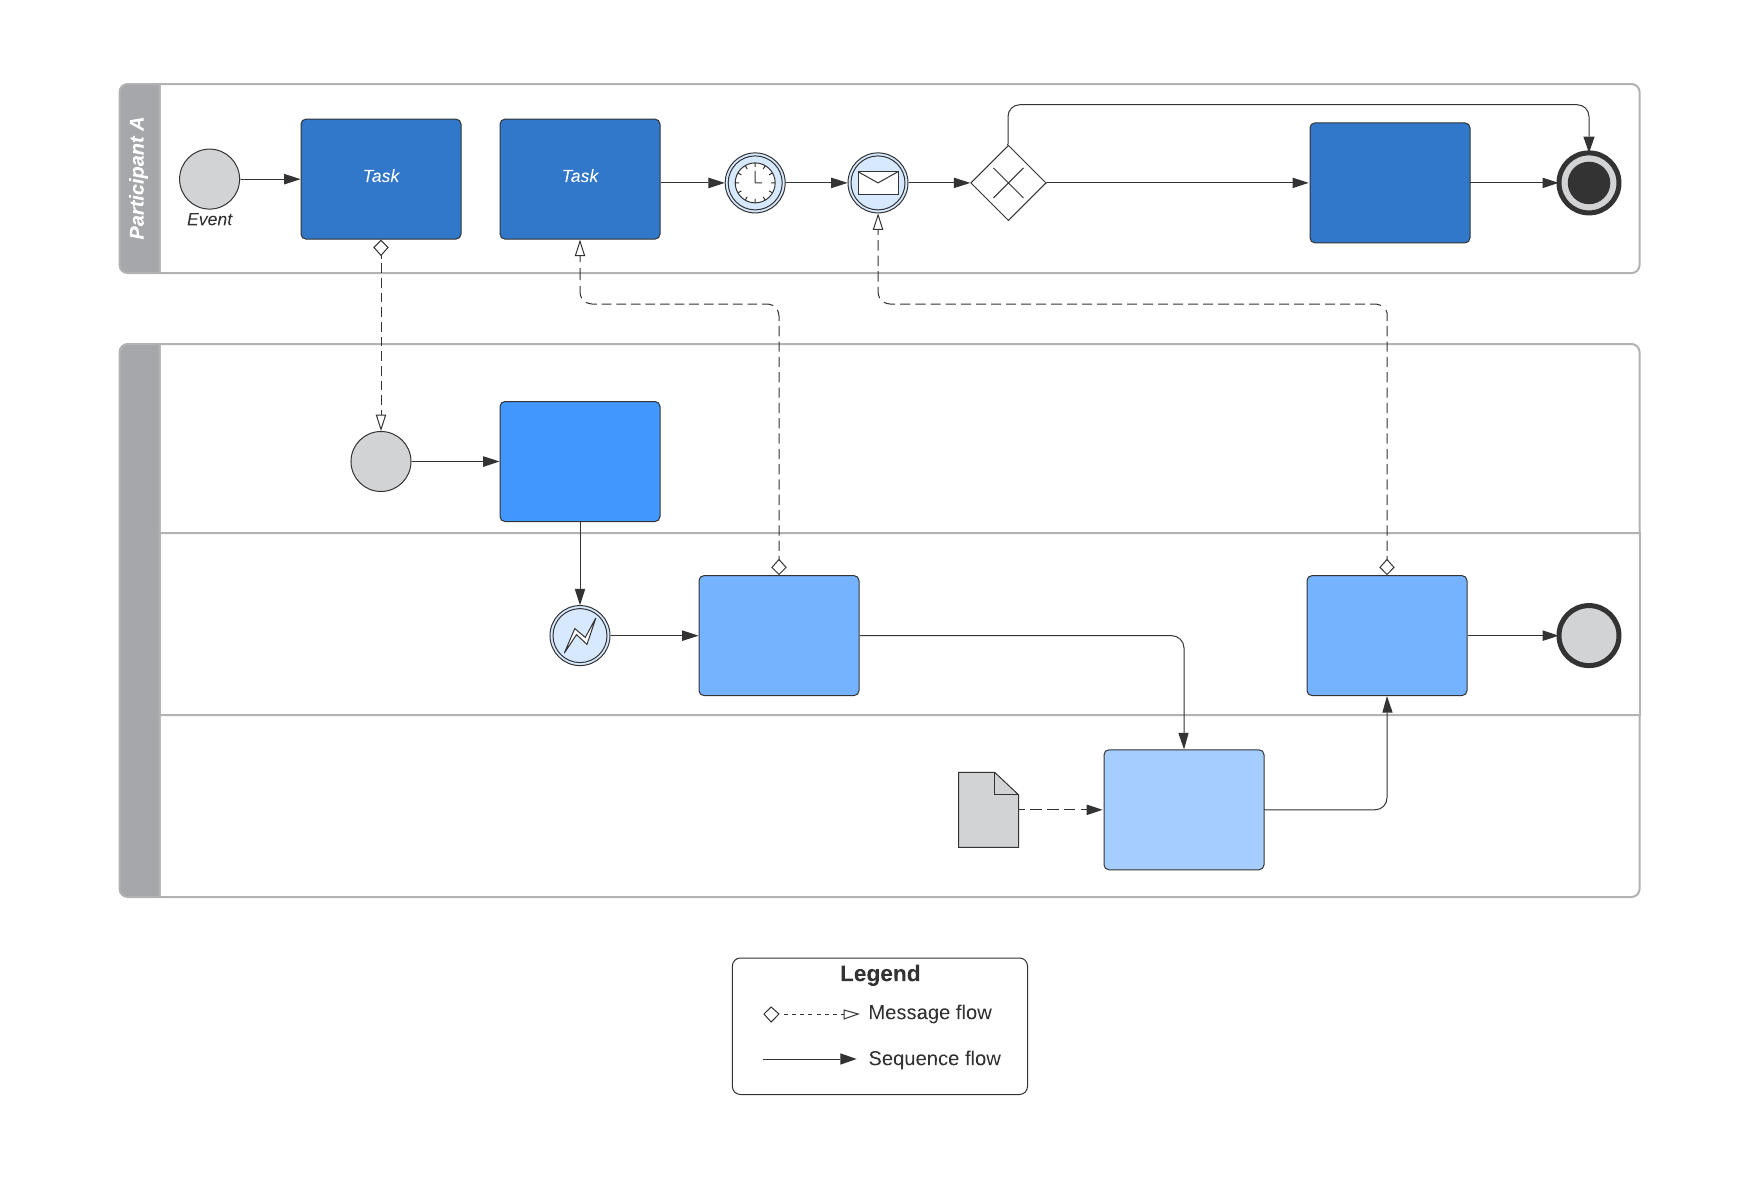
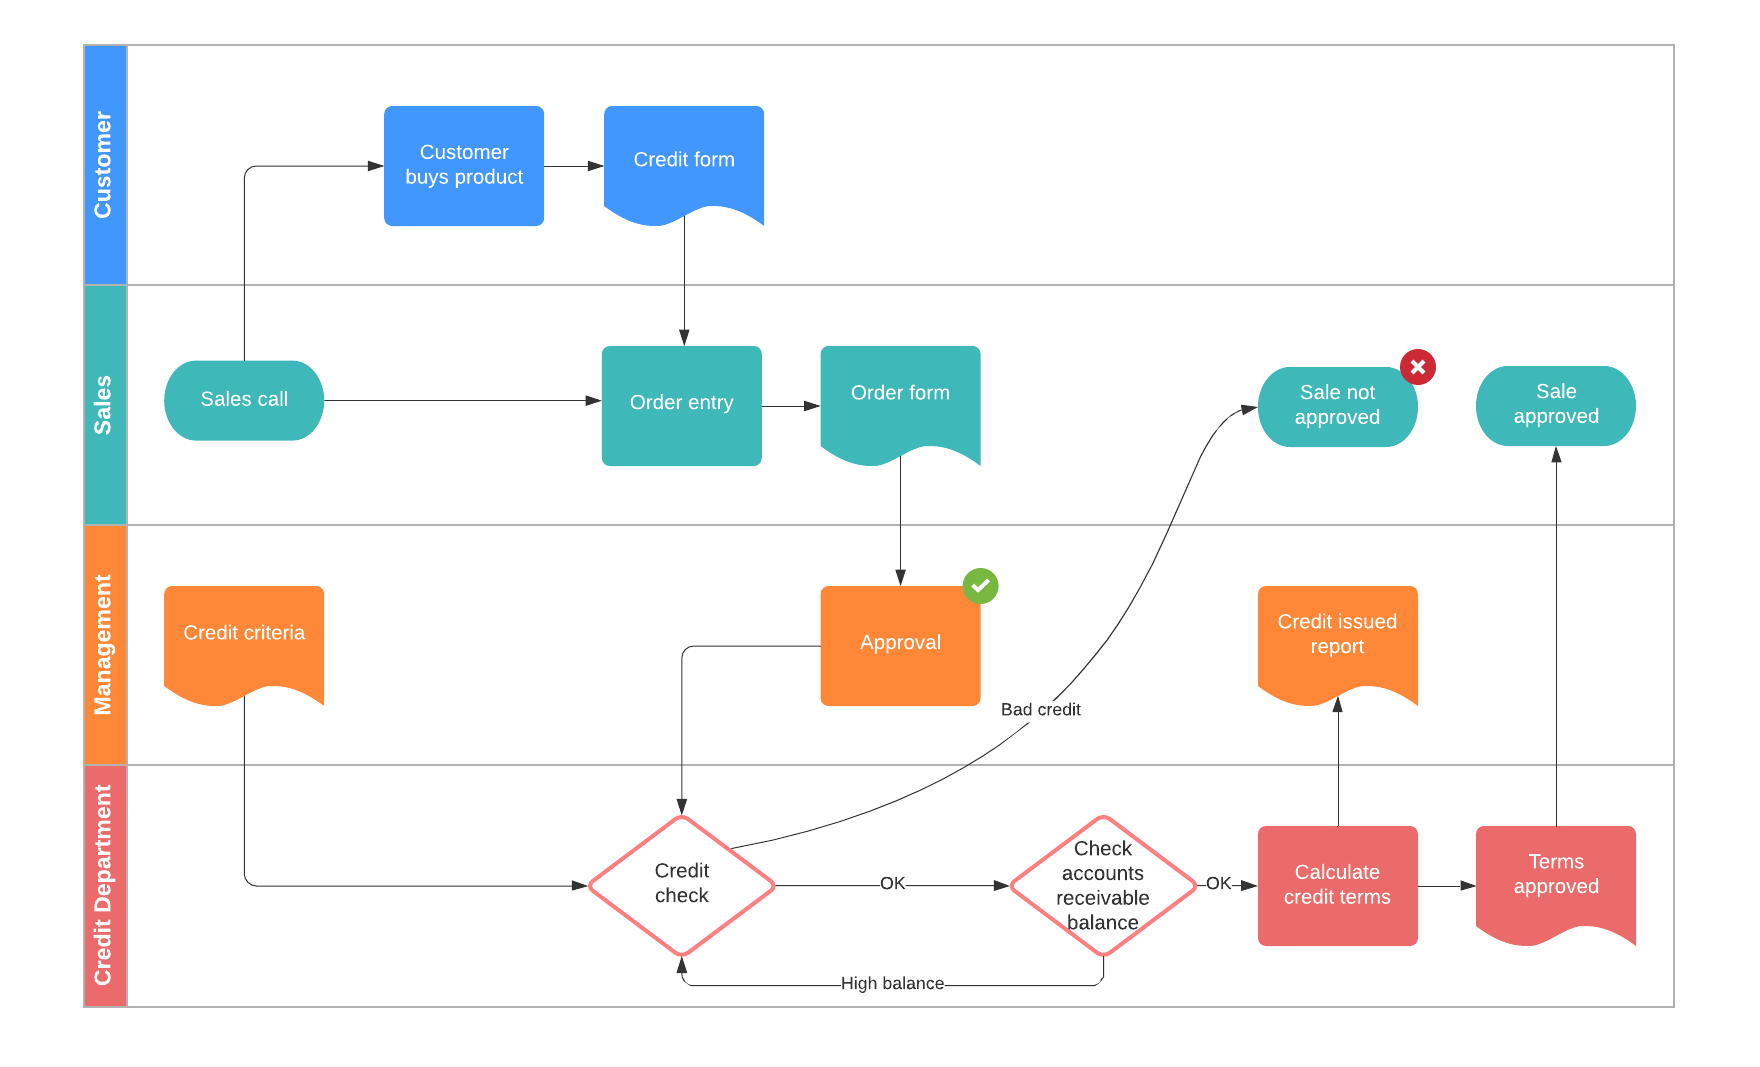
When examining your processes, first translate the obscure into the concrete. In other words, write it down and map them out. You can use a BPMN diagram, flowchart, swimlane diagram, value stream map, or whatever makes the most sense for your business processes.

For a more sophisticated and easily shareable approach, use Lucidchart. This platform will help you define processes and orchestrate them in an easy-to-understand, completely transparent flowchart.

BPMN diagram
Business Process Modeling Notation (BPMN) Diagram Example (Click on image to modify online)
business process flow template
Business Process Flow Template (Click on image to modify online)

Check out 3 more easy-to-use diagrams for making your processes more visual.

Let's go

2. Identify value-add activities and bottlenecks

Use your flowchart to understand what is working well with your current process. Highlight areas where you have the opportunity to optimize the process. If you’re using Lucidchart, you can even layer data, such as the process efficiency metrics discussed earlier, on top of your process flowchart.

When you visualize your processes, you can make informed decisions because you can see the loopholes and bottlenecks in your current process and approach stakeholders and decision-makers with evidence of processes that need to be optimized.

3. Build out the ideal process

Make changes to your diagram to develop solid processes that scale easily. If you’re using Lucidchart, it’s simple to send your process map to stakeholders, get their input with in-editor commenting, and quickly adjust the process based on feedback without starting from scratch.

These improvements could include implementing new software, improving communication, and even hiring project managers. It will also definitely involve a fair bit of creativity to determine alternative approaches to current routines. For instance, if your team members find they spend the majority of their days attending meetings, you may need to designate certain days of the week as “meeting-free” days that allow your employees to get more work done without distractions.

It’s important to note here that streamlining involves experimentation, much like using the scientific process. You will pose a hypothesis (for instance, “we should designate meeting-free days”), implement the theory, and then test it out. There’s no problem with discovering that your hypothesis was wrong; you can always revert back to your original process. The real danger is accepting stagnation as best practice.

4. Communicate changes to the rest of the company

It’s one thing to achieve process cycle efficiency with a team of four. It’s quite another to have a streamlined process with a team of 4,000. Without a tested, streamlined standard, your company will become exponentially less efficient as it scales.

In other words, your process efficiency will only improve when you and your colleagues take action, so once you’ve built out a more efficient process and gained approval, you need to document and share your process for others to follow.

The visual you have created can be used to help employees understand the entire cycle and where their role fits into the company’s process. Don’t underestimate the power of developing a visual representation of your company’s processes. The process flowchart is invaluable: It acts as a single source of truth and a guidepost that the entire team and company can reference.

The payoff

How does higher efficiency benefit your business in the long run?

It may seem obvious to say that more efficient processes will decrease turnaround or response time, lower production costs, and increase a business’s profits, but these results can also lead to fringe benefits. For example, if you can offer products faster or at a lower price, your company can meet higher demand and/or increase customer satisfaction—both of which will make your business more competitive in your industry.

visualize processes

Start reaping the benefits today. Visualize and analyze your processes in Lucidchart to develop a streamlined approach for meeting goals and reducing waste.

Learn more

Lucidchart

Lucidchart, a cloud-based intelligent diagramming application, is a core component of Lucid Software's Visual Collaboration Suite. This intuitive, cloud-based solution empowers teams to collaborate in real-time to build flowcharts, mockups, UML diagrams, customer journey maps, and more. Lucidchart propels teams forward to build the future faster. Lucid is proud to serve top businesses around the world, including customers such as Google, GE, and NBC Universal, and 99% of the Fortune 500. Lucid partners with industry leaders, including Google, Atlassian, and Microsoft. Since its founding, Lucid has received numerous awards for its products, business, and workplace culture. For more information, visit lucidchart.com.

Related articles

Bring your bright ideas to life.

Sign up free

or continue with

Sign in with GoogleSign inSign in with MicrosoftSign inSign in with SlackSign in

Get started

  • Pricing
  • Individual
  • Team
  • Enterprise
  • Contact sales
PrivacyLegal

© 2024 Lucid Software Inc.