2. Determine how visitors find your website
If you’re trying to improve a website or app that’s already built, dig into the data. Google Analytics will break down the percentages for each of the following entry methods:
- Direct traffic
- Organic search
- Paid advertising
- Social media
- Referral sites
- Email
Consider what these different entry points say about your users and how you can better adapt the experience to what they need. These entry points will be the start of your user flow diagram.
3. Identify what information your users need and when they need it
Now that you have a starting point, consider what information your user needs and what actions they should take. To convert users, you’ll deliver them the right information at the time they need it most.
Be sure to ask yourself questions as you create your user flow diagram to get you into the mind of your customer, such as “What action should I take on this page if I were my customer?” “How do I navigate the checkout process?” and “If I were this customer, how would I feel about this testimonial video?” Consider what the customer wants out of a particular page, what they may be feeling, and what mindset they’re in.
If you’re optimizing an existing website, look at what’s working now. In other words, when people buy or perform other successful activities, what paths have they taken through your site? Don’t focus on just purchase: It may take several visits to a site before a customer completes a sale. However, if a visitor signs up for your newsletter or submits text notifications via a pop-up, that counts as a success.
4. Map out your user flow
Now that you know your audience, their motivations, and the typical paths they’re following to perform various actions, you can begin to actually create a user flow diagram. Choose a visual workspace where you can easily drag and drop shapes into the user path and notate opportunities to delight and inform your customer.
Start with shapes that indicate entry points, such as organic or paid. You can even use low-fidelity wireframe shapes here instead of just geometric shapes to give an idea of what the site or app should look like and where your calls-to-action live.
Next, determine what the landing page will be and what decisions your customer will have to make on that page. Make further shapes and decision points until the flow is completed.
Your user flow diagram may change over time, depending on how your audience changes and what their motivations are for navigating your site.
5. Gather feedback, finalize, and share
If you’re building a new site or application, share your user flow diagram with other stakeholders to gather feedback and make adjustments. This visual is especially powerful in this circumstance because stakeholders can understand the experience you’re proposing at a glance.
Once you have finalized the user flow diagram, share it with UX designers, web developers, software engineers, and other team members to provide context before they start building or designing your website or app.
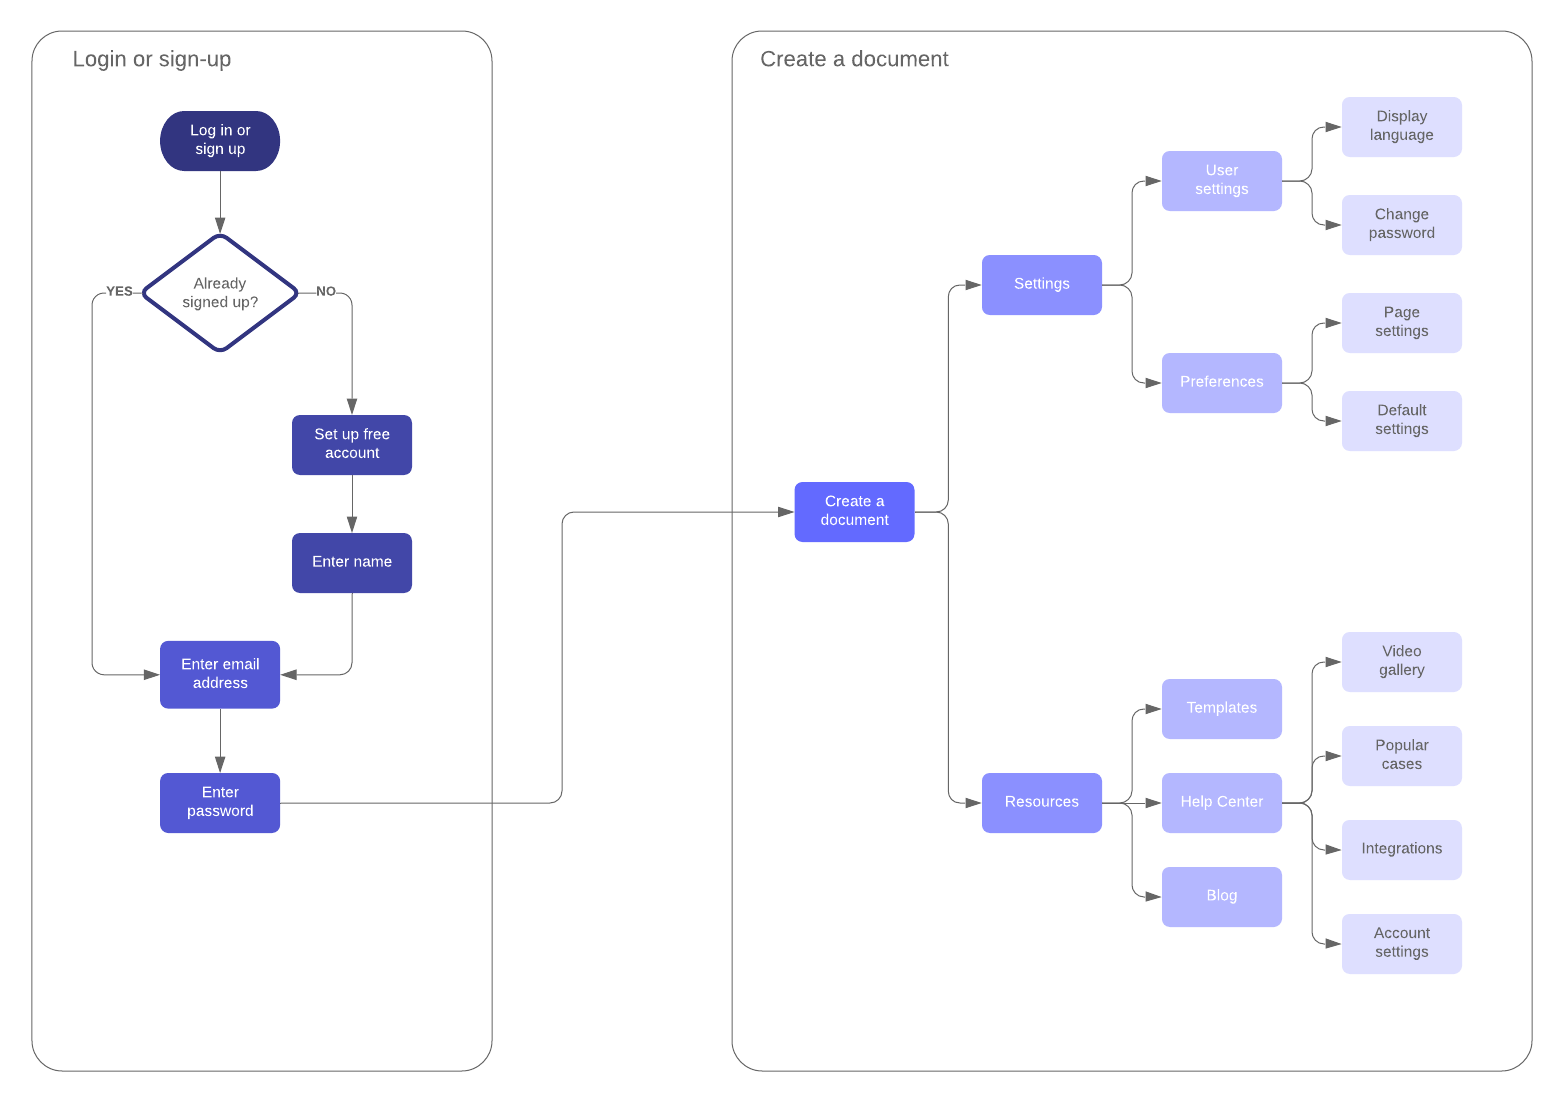
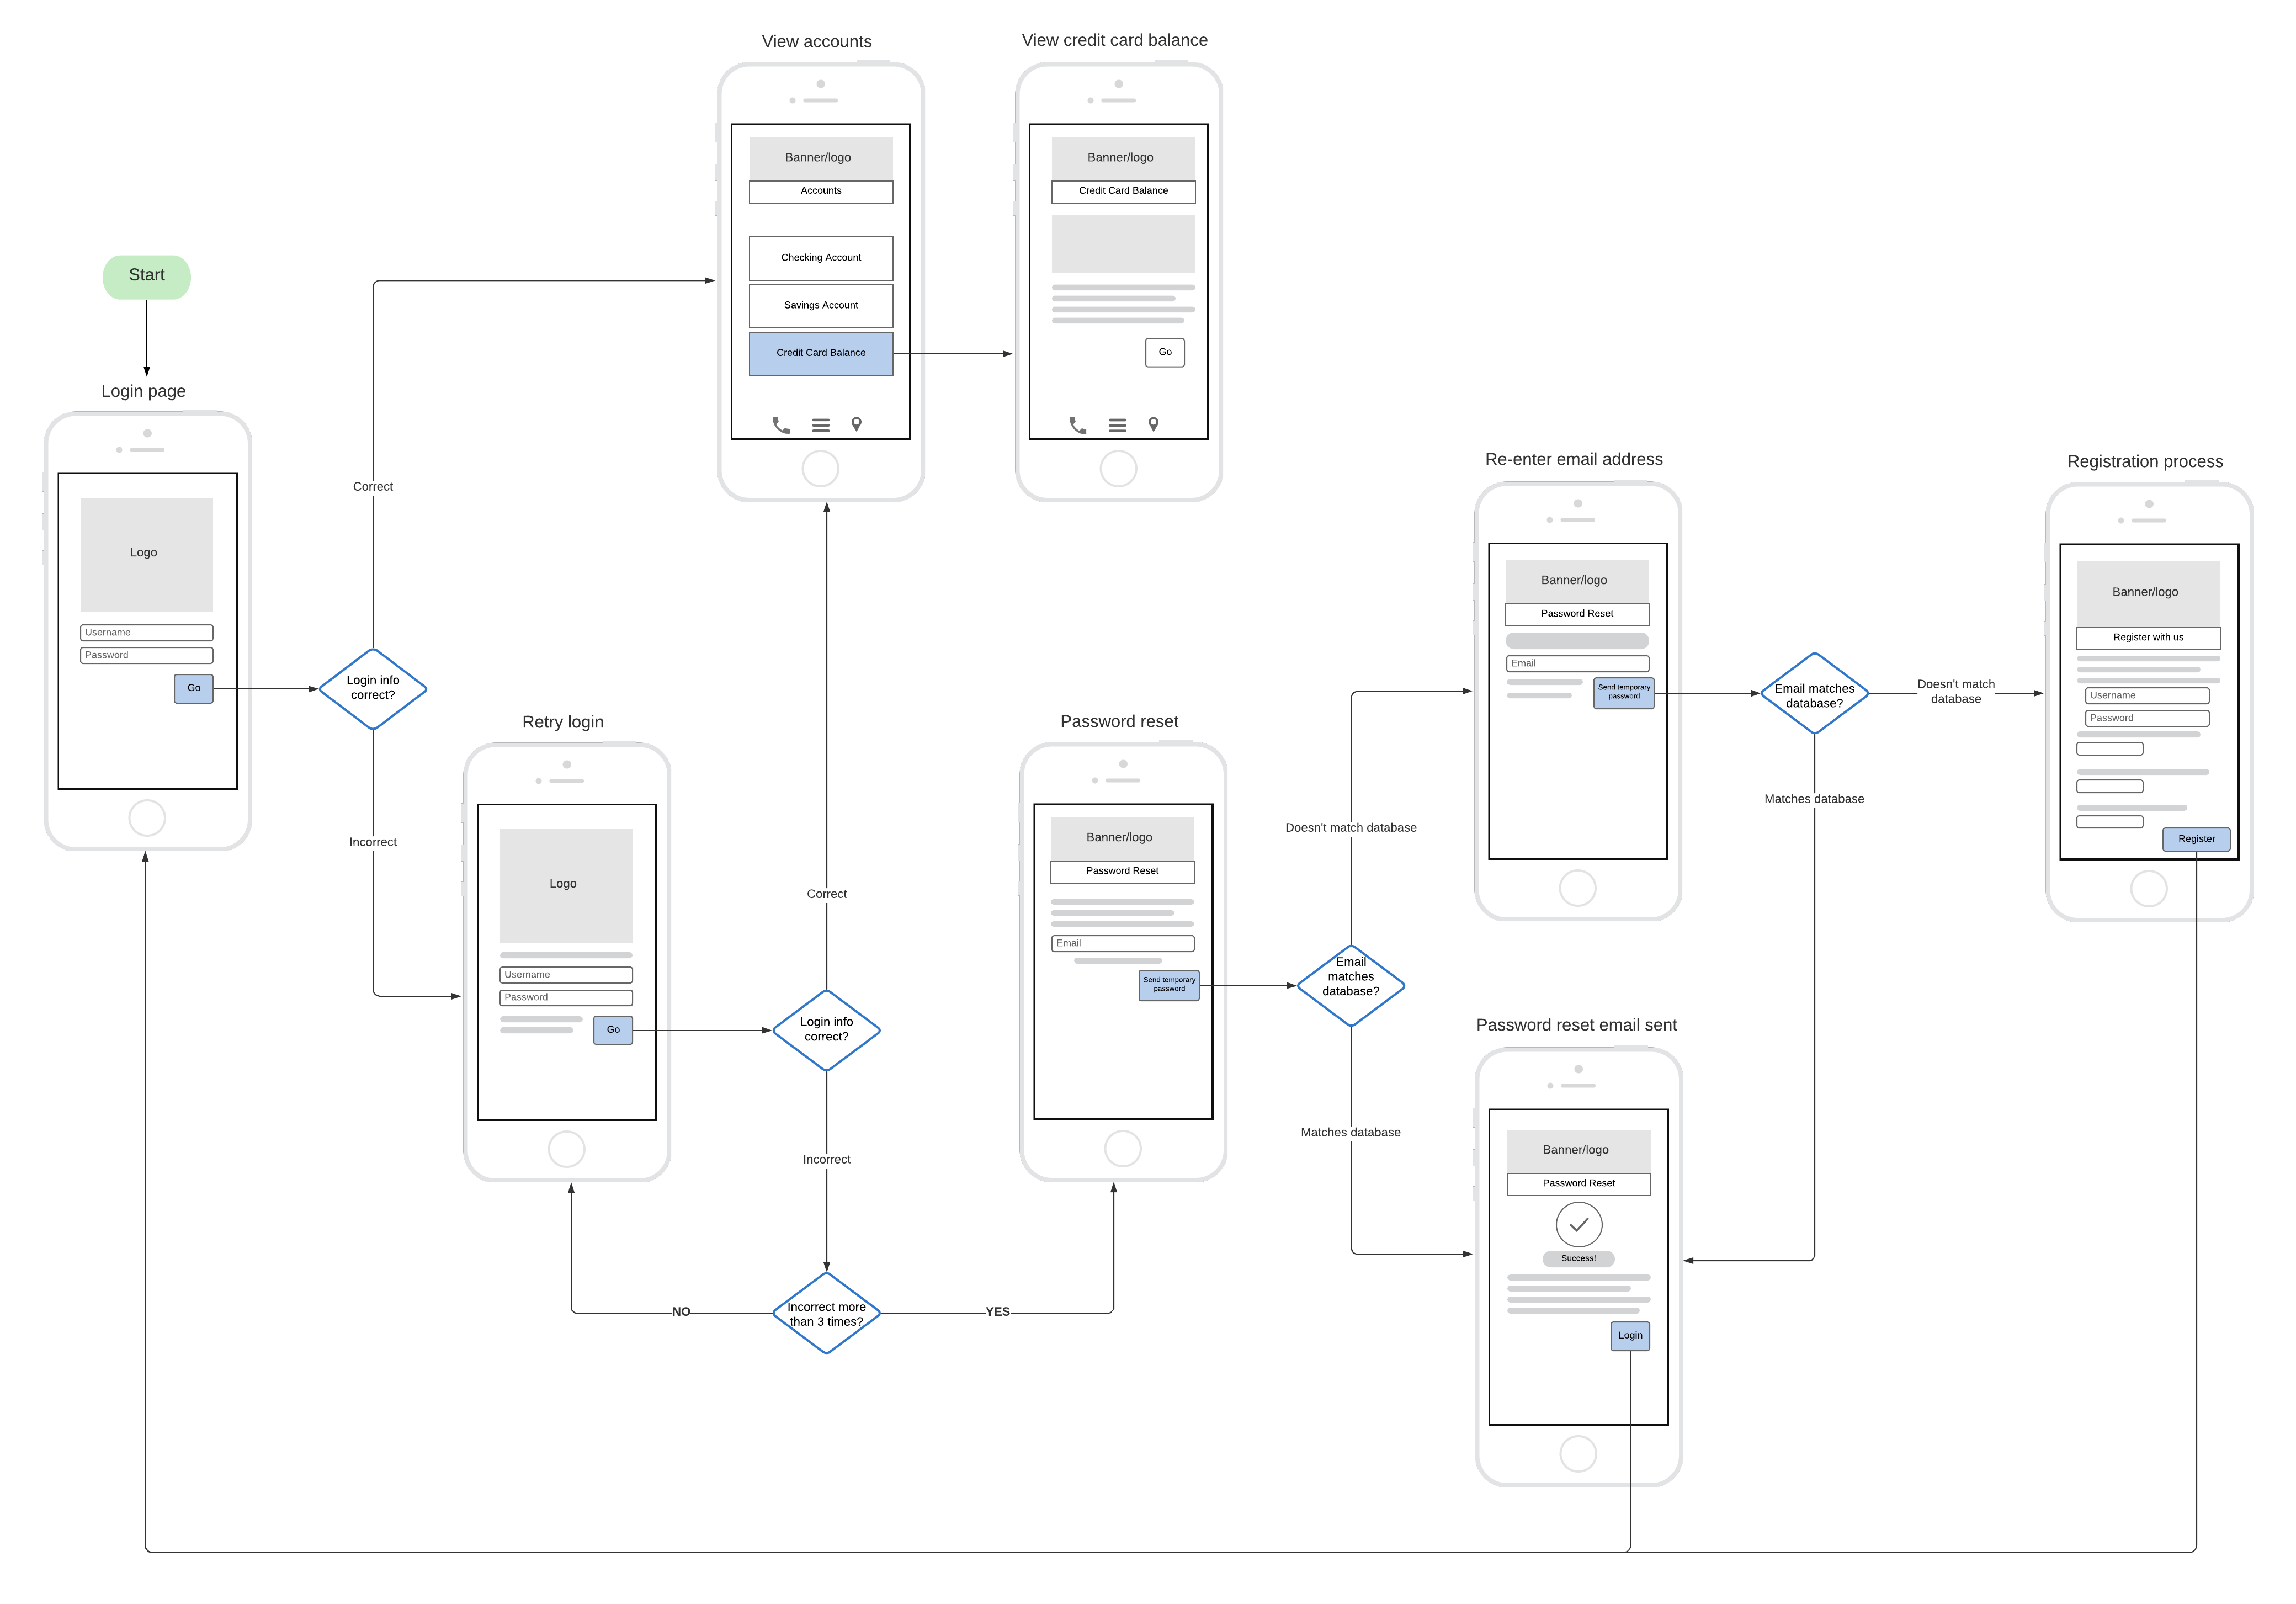
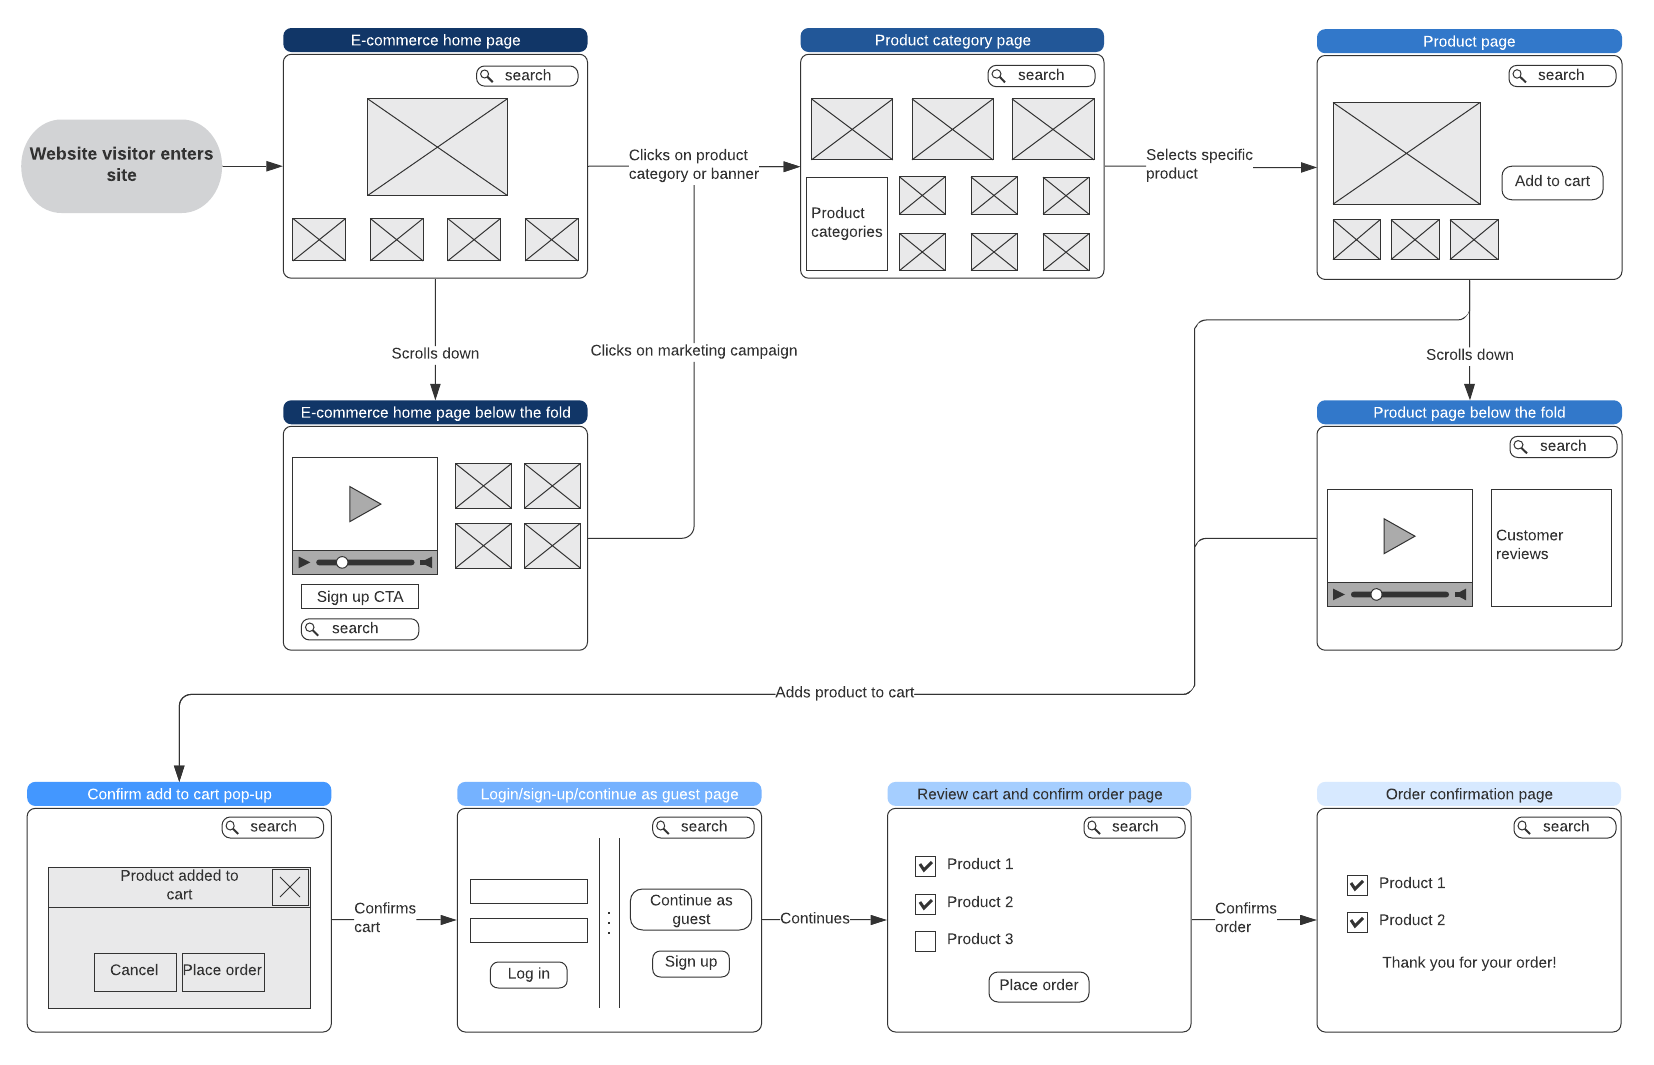
Examples of user flow diagrams
Take inspiration from these user flow diagram examples. These examples include wireflows, which combine wireframe shapes with standard flowchart shapes so you can visualize what your website or app should look like, as well how users should navigate through it.
Click on any example to use as a template in Lucidchart.