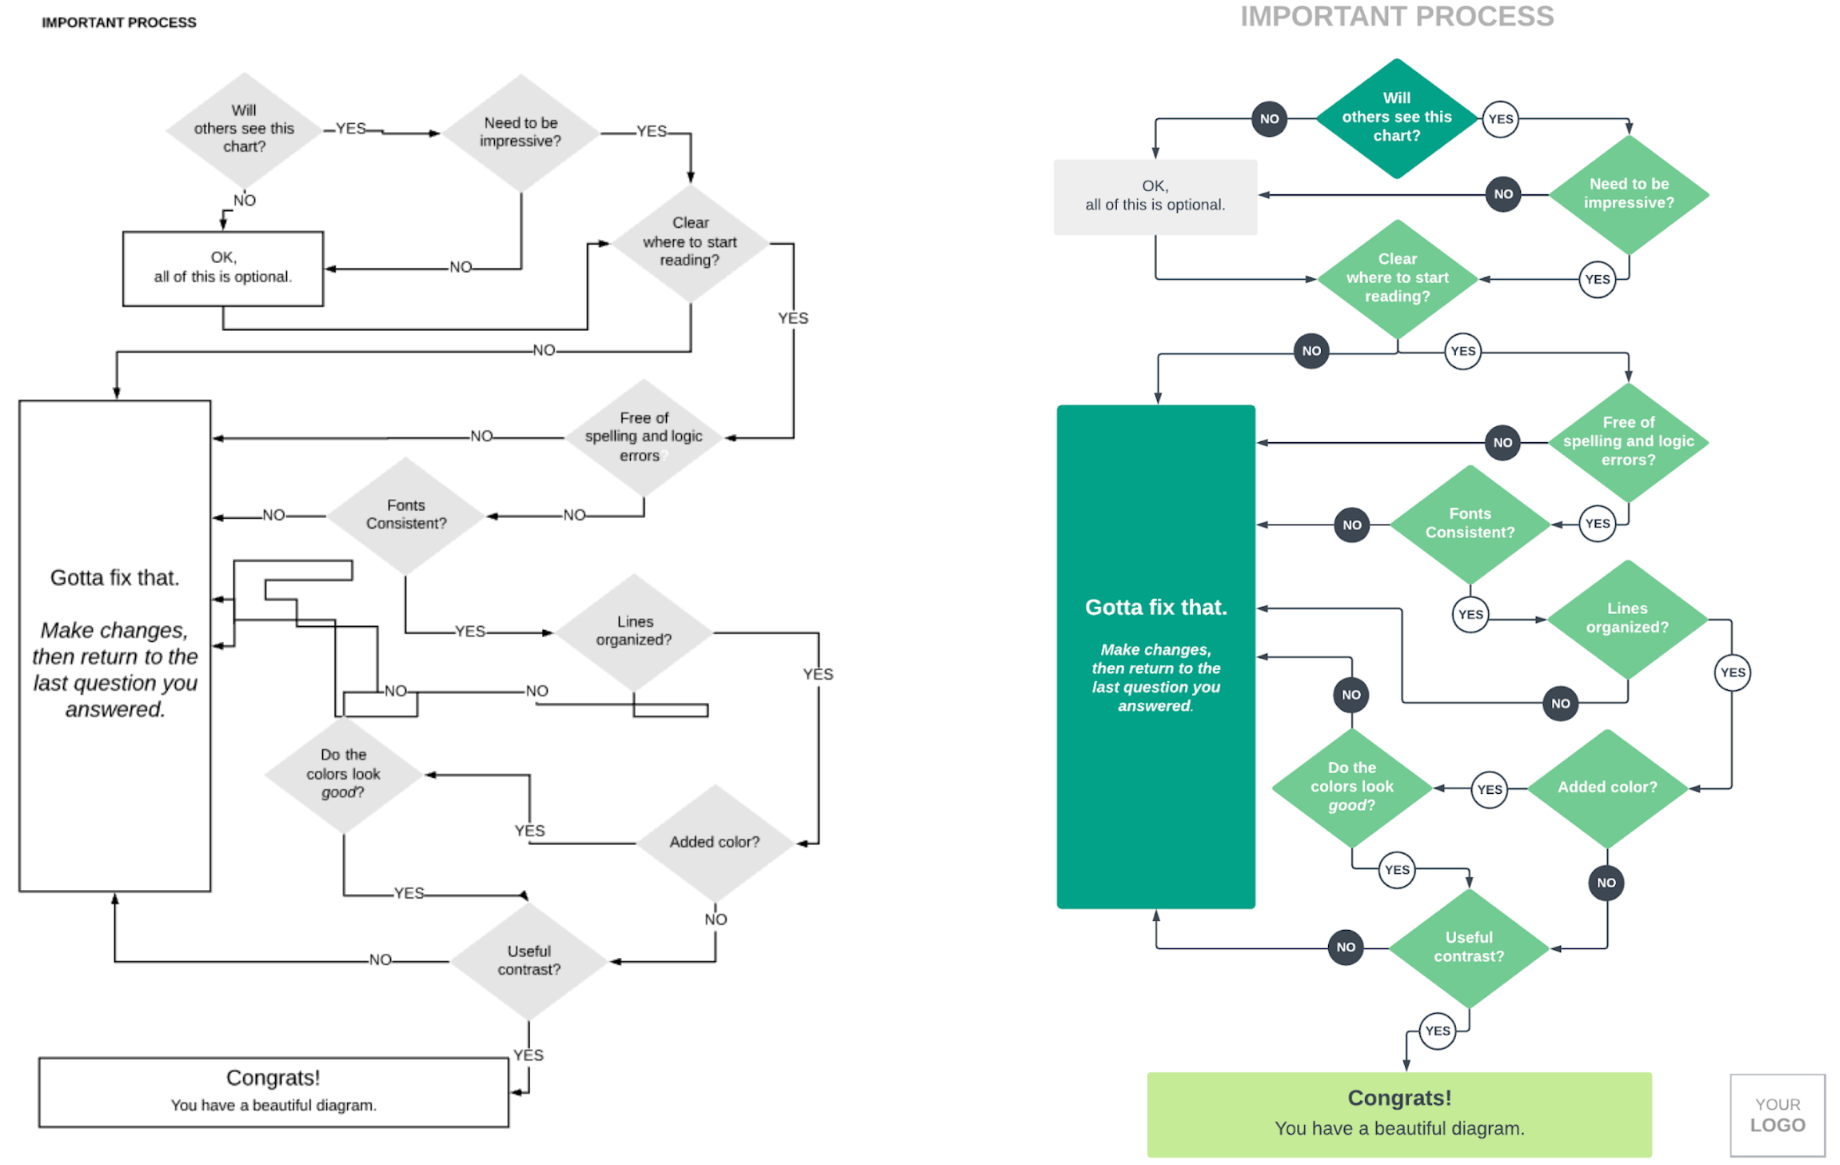
We probably don’t need to convince you that flowcharts are a fast and easy way to communicate complex processes and ideas. But often flowcharts end up sloppy, disorganized, and confusing, so they don’t communicate your message as clearly as you would like.
For example, which of these flowcharts looks more appealing? The flowchart on the left could be difficult to follow because it’s monochromatic and the shapes and lines aren’t all aligned. The flowchart on the right uses proper alignment and different colors, font sizes, and shapes to guide you through to the end.
Use the five tips below to make your online flowcharts clearer and more effective with only a few extra clicks.
Tip 1: Orientation
Lines and arrows guide people through the steps of your flowchart. Make sure each shape is connected to other shapes, and remember the first rule of flowcharts: Lines and arrows should move from top to bottom or left to right.
You add further clarity to your process flow by organizing your flowchart into swimlanes. A swimlane diagram slots each step into a horizontal or vertical “swimlane” to delineate who does what. For example, you can create a swimlane for each department (such as sales, marketing, development, etc.). Each step that falls within a department’s lane is their responsibility.
Tip 2: Start and finish points
Make it clear where the flowchart starts and where it ends. Often, the terminator shape is used to designate the start and end of a flowchart; however, you can use placement (top left for start, bottom right for end), color (green for start, red for end), or size to clearly show where to start and where the process ends.
Tip 3: Color
When it comes to color, more is not necessarily better. Try to use three or fewer colors in a single flowchart.
You also want to make sure you choose colors that match so your flowchart doesn’t turn into an eyesore. One easy way to find complementary colors is to use a branded image as inspiration. In Lucidchart, you can copy and paste an image onto your diagram, use the eyedropper tool to match colors, and then delete the image once you’re done. Follow along with the YouTube tutorial video below.

Explore all the ways Lucidchart is the best tool for making a dynamic flowchart.
Go nowAbout Lucidchart
Lucidchart, a cloud-based intelligent diagramming application, is a core component of Lucid Software's Visual Collaboration Suite. This intuitive, cloud-based solution empowers teams to collaborate in real-time to build flowcharts, mockups, UML diagrams, customer journey maps, and more. Lucidchart propels teams forward to build the future faster. Lucid is proud to serve top businesses around the world, including customers such as Google, GE, and NBC Universal, and 99% of the Fortune 500. Lucid partners with industry leaders, including Google, Atlassian, and Microsoft. Since its founding, Lucid has received numerous awards for its products, business, and workplace culture. For more information, visit lucidchart.com.
Related articles
Data flow diagram examples, symbols, types, and tips
Whether you are improving an existing process or implementing a new one, data flow diagrams can make your task easier—learn how with this guide.
How to make a flowchart in Google Docs
Learn how to make a flowchart in Google Docs and help collaborators understand ideas, information, and processes quickly. We'll walk through the process of creating a flowchart with Google Drawings and with the Lucidchart add-on.


