The idea is to help team members, management, and stakeholders to more clearly understand the process flow, who does what, how it gets done, and when it gets done. In addition, process mapping helps you to improve current processes and develop new ones. Process maps can help you train employees, assign tasks, stay in compliance, and more.
Process mapping is helpful when your company decides that changes need to be made. Mapping current processes gives stakeholders and team members an overall view of how things are done in your organization. This encourages everybody to think through workflows and to see how everything fits together. Looking at current processes objectively and getting input from multiple interested parties helps you to see where improvements can be made so you can work more efficiently and get products to market faster.
What are the benefits of process visualization?
Process visualization is important because it gives you the opportunity to learn, analyze, improve, and standardize processes. Other benefits include:
- Brings everybody together: Creating a process map is not a one person job. Bringing together everybody involved helps you to see things from different perspectives, which gives you better insight into how things are done in your company. This helps everybody to see the big picture so they can see how their work fits in the overall process and affects others. Bringing everybody together can also increase employee morale by helping team members feel like they are making meaningful contributions.
- Effectively communicates insights: Seeing the big picture gives you a better idea of how everything works together. This gives the team insight into how things are done in the company, which helps them to make better decisions and look for ways to improve processes and procedures.
- Simplifies the complex: Because a process map gives you a bird’s-eye view, it makes complicated processes easier to understand. It also helps you to more easily identify and fix problem areas.
- Documents best practices: The process of creating visualizations helps you to refine and streamline processes and makes it easier to spread the information throughout the company. This is especially helpful for new members of your team who are trying to understand their roles and how they fit into the process.
- Better organization and efficiency: Process visualizations can help your company to be more efficient and organized as you streamline processes and define best practices.
How do you improve visualization?
Every process map will be different and will focus on different things. This can take some time and should take some consideration. But don't overthink it or make it more complicated than it needs to be. The goal is to produce a document that is easy to read and understand so it will be used by its intended audience. Following are a few tips on how to improve visualization.
Identify the start and end points
It helps to know where the process begins and where it ends before you start identifying specific steps in the process. This helps you with setting limits and finding the fastest and most efficient route from the beginning to the end. Knowing the start and end points also helps you to identify what is really important.
Simple is better
Keep your process maps as simple as possible so that they can be easily read by anybody in your organization. Overly complicated visuals are hard to read and understand and likely won’t be used by the people who need them.
Remove unnecessary and redundant information
Leave out any unnecessary or redundant information, excessive color, obscure jargon, or anything that distracts and takes focus away from important information. Also, realize that your process visualization will never be perfect. Instead, aim for a level of detail that is necessary to make the process understandable.
Use color
When visualizing processes, be sure to incorporate color in your designs. While a black and white map is better than text alone, it looks static and does not draw the attention that color can draw. Color can be used to represent specific symbols, steps, or data. And color helps you to categorize, organize, and highlight important information. Consistent use of color makes it easier to understand what the information is telling you at a glance.
Use shapes and symbols
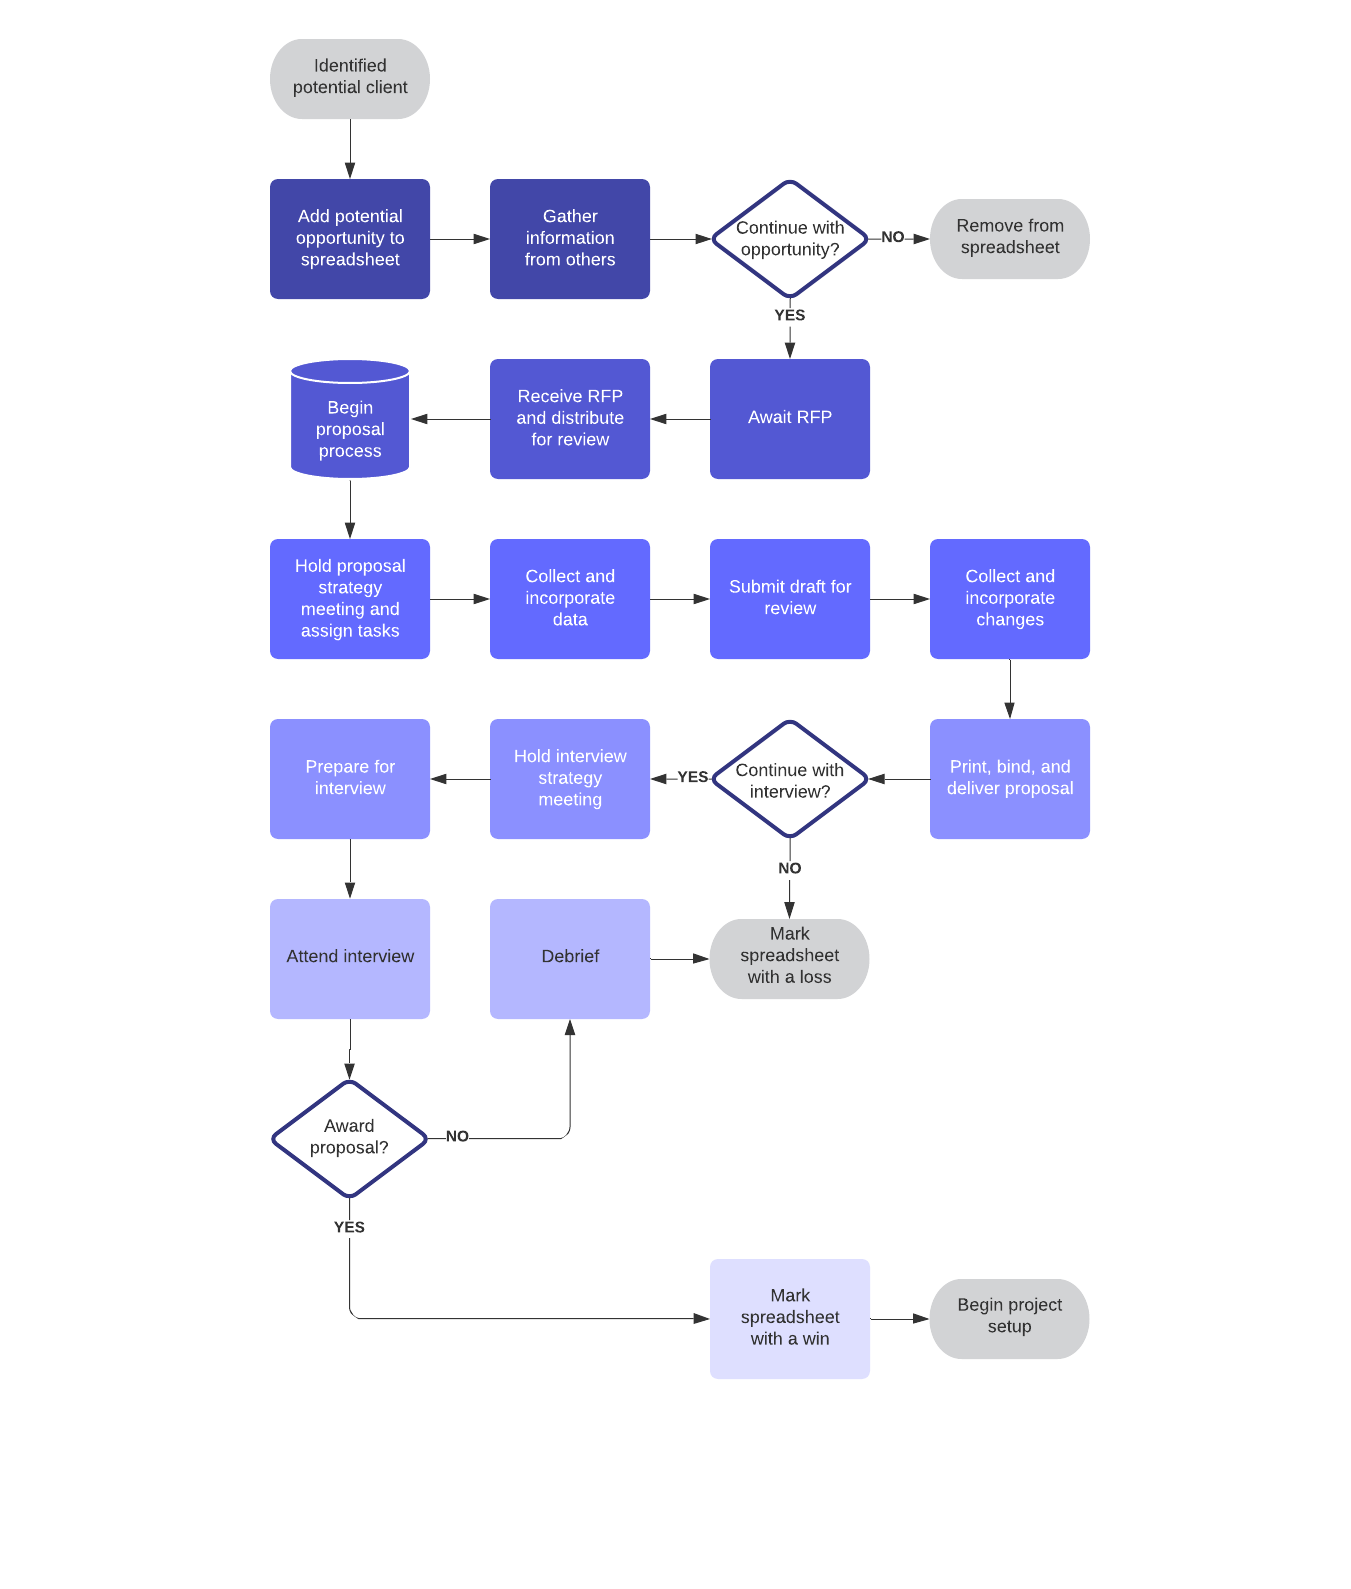
There are standard shapes and symbols that should be used when creating specific types of maps and charts. Be consistent when using shapes and symbols so you don’t confuse your audience. For example, some of the simplest shapes include:
- Ovals or circles to represent process start and end points
- Rectangles for tasks and activities
- Diamonds to represent decisions that need to be made in the process
- Arrows to indicate the process flow
Indicate hierarchy
The use of color, the order of different elements, and sizing can indicate the importance of different tasks and procedures in the process flow. It can also be used to highlight dependencies between tasks.
Use process mapping software
Process visualization software like Lucidchart includes templates and libraries of standard shapes and symbols to keep your visuals simple and consistent. It also lets you draw maps and charts quickly and encourages collaboration and input from all team members.
Group data
Grouping data into logical categories improves readability and helps your audience to see and digest the information they need easily and quickly.
Next steps
Process visualization can take your work to the next level. But once you have created your process map, you’re not quite done. You need to implement the process, monitor it, manage it, and make improvements where warranted.