Lucidchart vs. Miro
Compare Miro’s online whiteboard with Lucidchart, the intelligent diagramming application. See how Lucidchart beats Miro on data and automation capabilities to support broader use cases.


By registering, you agree to our Terms of Service and you acknowledge that you have read and understand our Privacy Policy.


Lucid is the market leader in visual collaboration
Lucid enables deep diagramming and deep collaboration
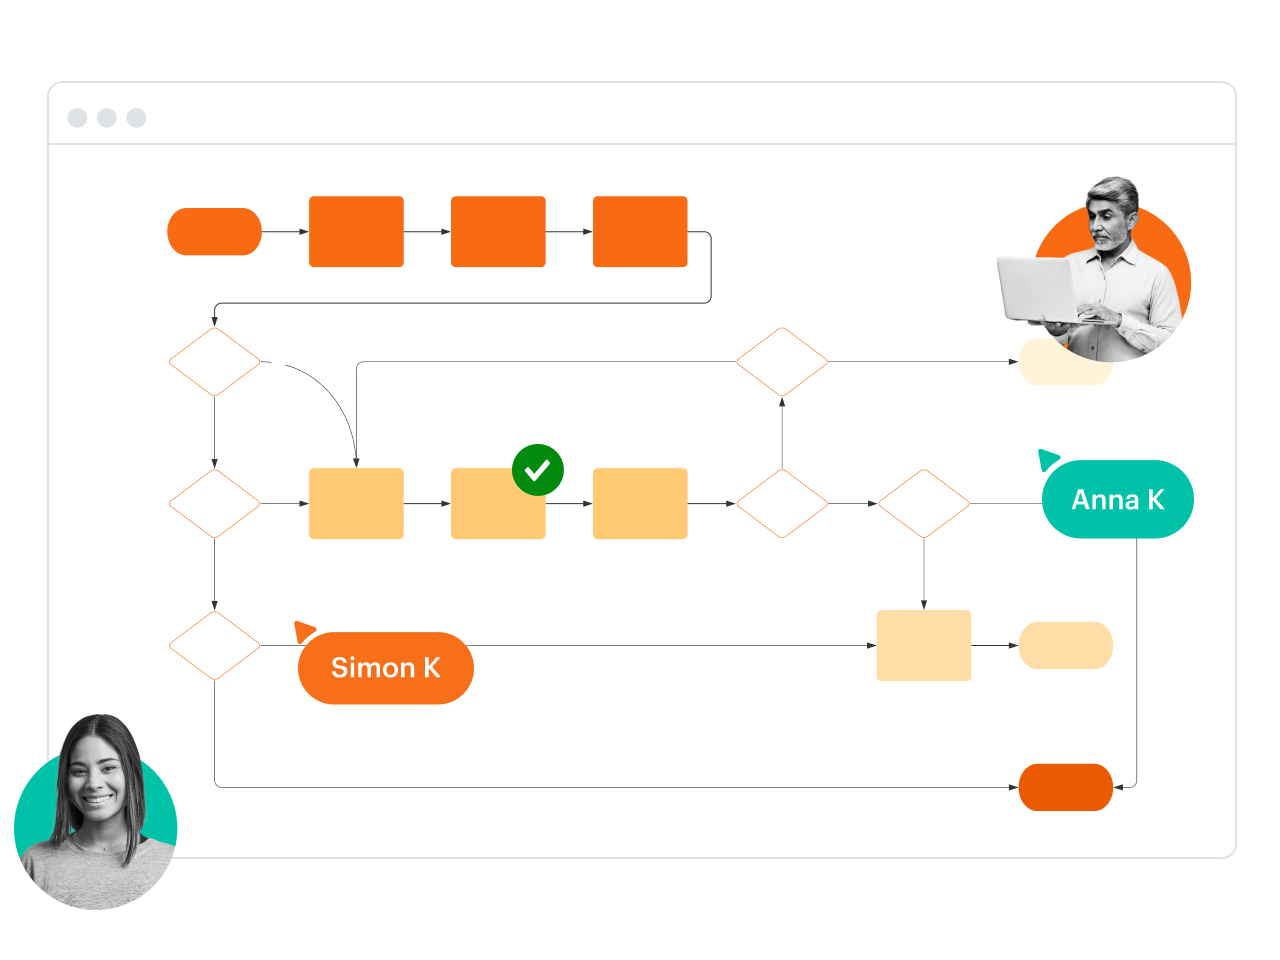
Lucid supports every stage of your workflow


Designed to help you transform complex data into actionable insights, Lucid is the most used visual collaboration platform. In contrast, Miro lacks features that make diagrams actionable.
Why teams choose Lucidchart

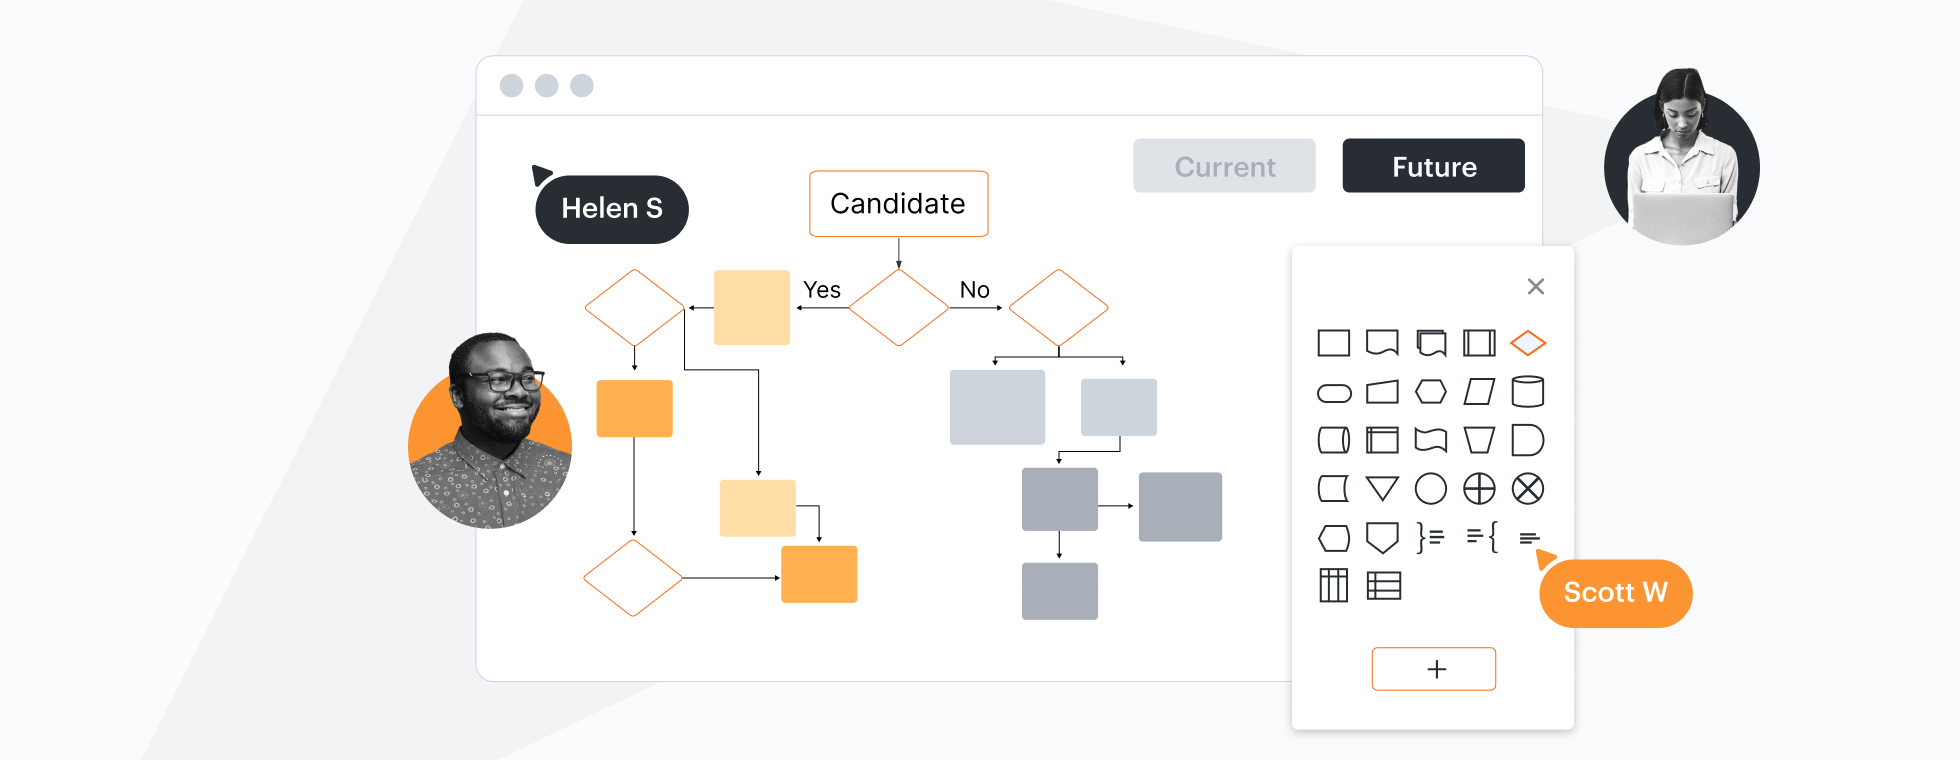
Data-linked process diagrams and flowcharts
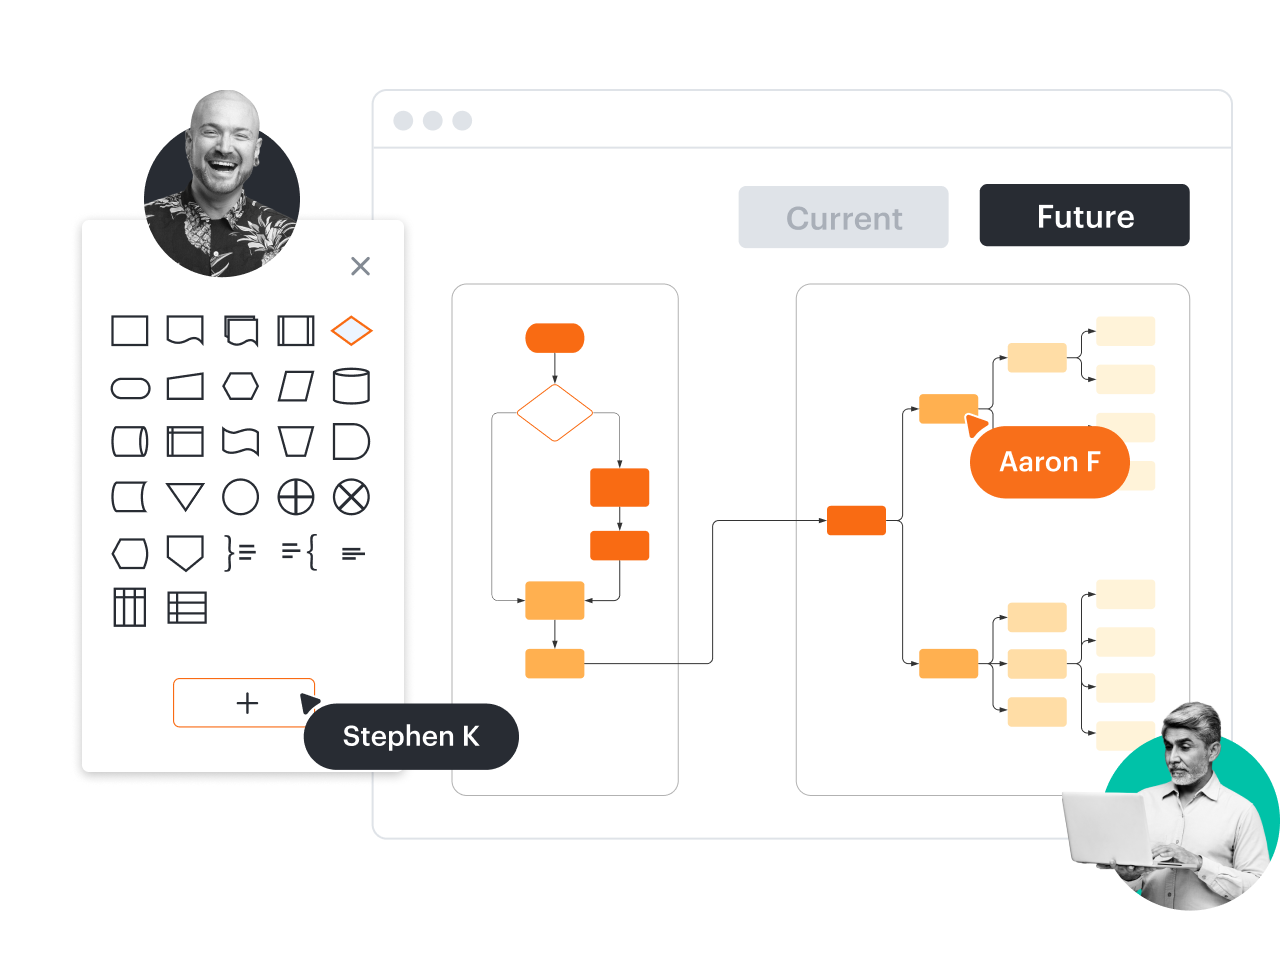
Technical diagrams with greater detail
Time-saving org chart automation
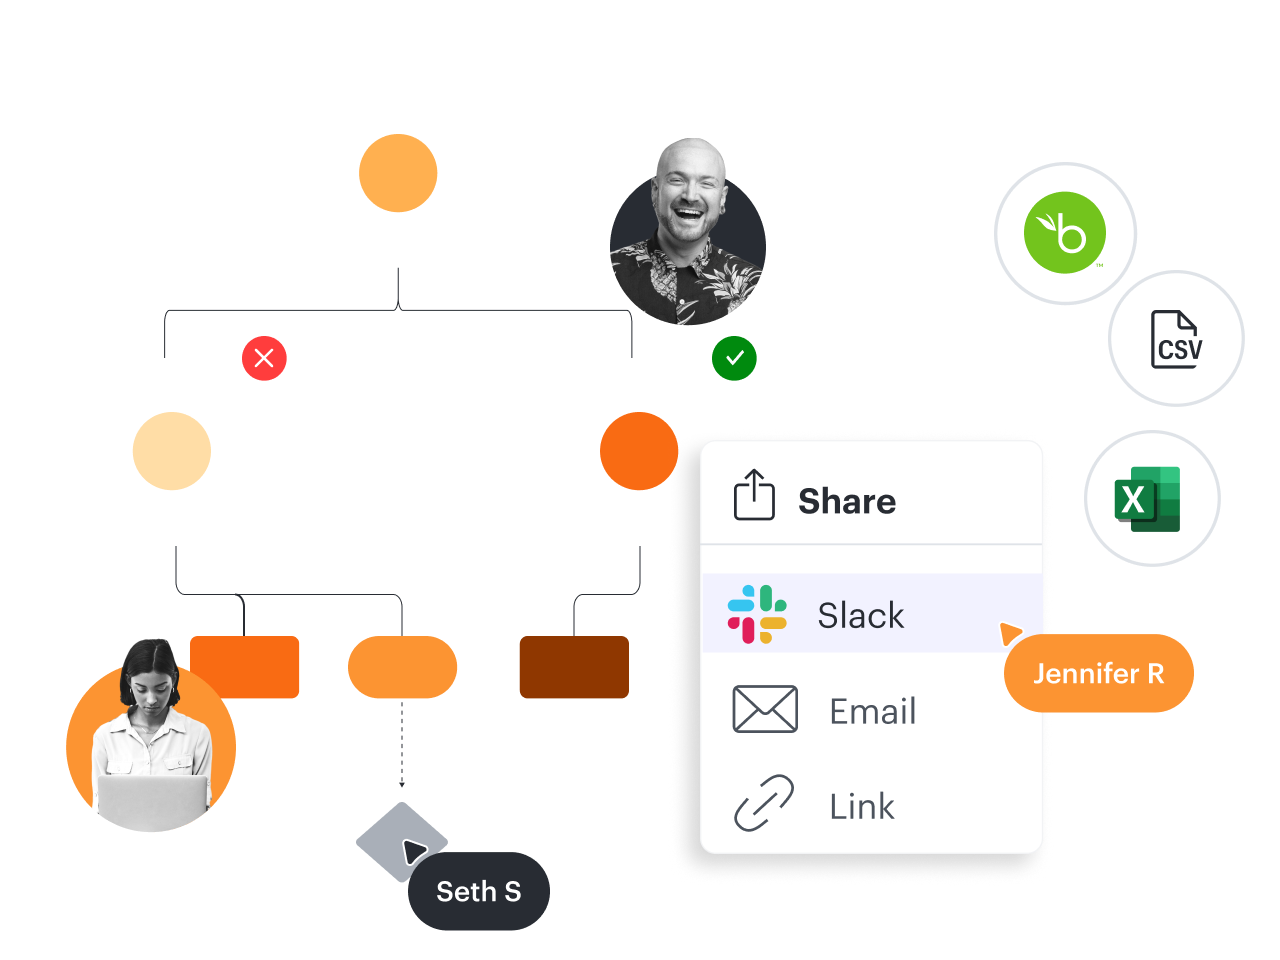
Account mapping to streamline sales

Mobile mockups for cross-team collaboration
| Features | Lucidchart | Miro |
|---|---|---|
| Advanced diagramming features | ||
| Process diagram | Feature is included | Feature is included |
| Templates | Feature is included | Feature is included |
| Layers | Feature is included | Feature is not included |
| Tasks | Feature is included | Feature is not included |
| Shape actions | Feature is included | Feature is included |
| Sticky notes | Feature is included | Feature is included |
| Org chart shapes with data and photos | Feature is included | Feature is not included |
| Org chart group view | Feature is included | Feature is not included |
| Compare versions | Feature is included | Feature is not included |
| Compare docs | Feature is included | Feature is not included |
| Revision history with versioning | Feature is included | Feature is included |
| Data overlay | Feature is included | Feature is not included |
| Data refresh | Feature is included | Feature is not included |
| Mobile (iOS/Android) mockup shape libraries | Feature is included | Feature is included |
| Data and automation features | ||
| Shape libraries | Feature is included | Feature is included |
| Basic swimlanes | Feature is included | Feature is included |
| Formulas | Feature is included | Feature is not included |
| Custom shape data fields | Feature is included | Feature is not included |
| Conditional formatting | Feature is included | Feature is not included |
| Data linking | Feature is included | Feature is not included |
| Data-linked dashboards and reports | Feature is included | Feature is not included |
| Dynamic shapes | Feature is included | Feature is not included |
| Smart containers | Feature is included | Feature is not included |
| Integrations for advanced diagramming use cases | ||
| BambooHR | Feature is included | Feature is not included |
| ERD import and export from SQL | Feature is included | Feature is not included |
| Salesforce shape library or template | Feature is included | Feature is not included |
| ServiceNow integration | Feature is included | Feature is not included |
| LeanIX integration | Feature is included | Feature is not included |
| Sharing and collaboration | ||
| Download | Feature is included | Feature is included |
| Email and link sharing | Feature is included | Feature is included |
| Join ID | Feature is included | Feature is not included |
| Add passcode / expiration date to share links | Feature is included | Feature is not included |
| Publish without password | Feature is included | Feature is not included |
Feature is included | Feature is not included | |
| Offline mode | Feature is included | Feature is not included |
| Presentation mode | Feature is included | Feature is included |
More resources to help you compare Lucidchart vs. Miro
Lucidchart checks all the boxes for visualizations that support brainstorming and building.
What is intelligent diagramming?
Buyer’s guide: How to evaluate visual collaboration platforms
Lucidchart template gallery
How Lucidchart compares to other competitors
See for yourself why Lucidchart is the best choice across the board.