With a timeline software, you can create organized timelines that align your team on project progress, easily outline historical events and movements, or help educate visual learners with easy-to-use visual aids. This guide will cover everything you need to know about what a timeline is, how it’s used, and how to create the timeline you need.
6 minute read
Want to make a Diagram of your own? Try Lucidchart. It's quick, easy, and completely free.
What is a timeline?
A timeline is a visual representation of a chronological sequence of events within a story, process, or history. Presented in either a horizontal or vertical format, timelines provide users with a simplified means of understanding how various events, people, and actions have played or will play a role in any given process or period of time. Timelines can also be combined with text and graphics to produce infographics, which can easily convey statistics, historical events, and other information.
Types of timelines
You can select from a number of different timeline options and formats when deciding how best to visualize your information. Here are some of the most common timeline types to choose from:
Horizontal timeline: Horizontal timelines present information in chronological order from the left-hand side of the page to the right-hand side.
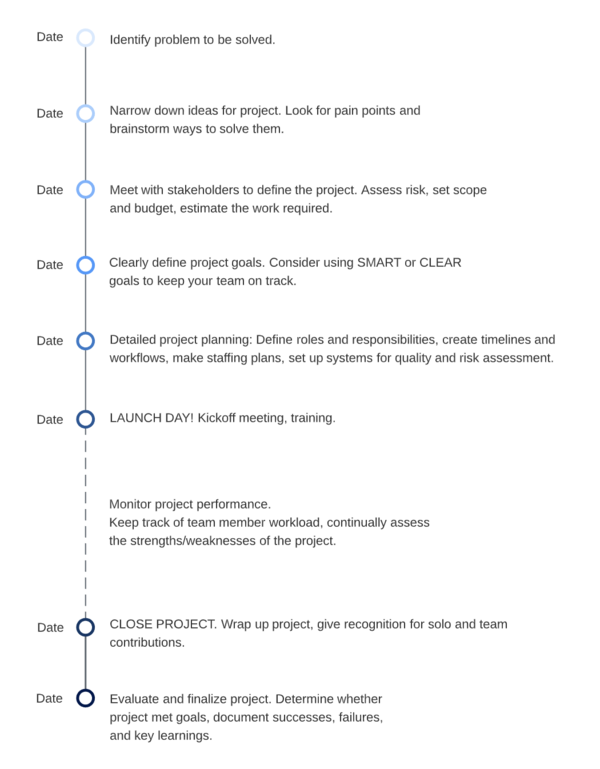
Vertical timeline: In vertical timelines, information is presented chronologically with the first event at the top of the page, the last at the bottom. Events and other information are added using horizontal branches off of either side of the timeline.
Chronological timeline: Chronological timelines outline a specific order of events, usually beginning with the earliest possible event on the left-hand side and the latest on the right-hand side. They are most effective when visualizing historical events.
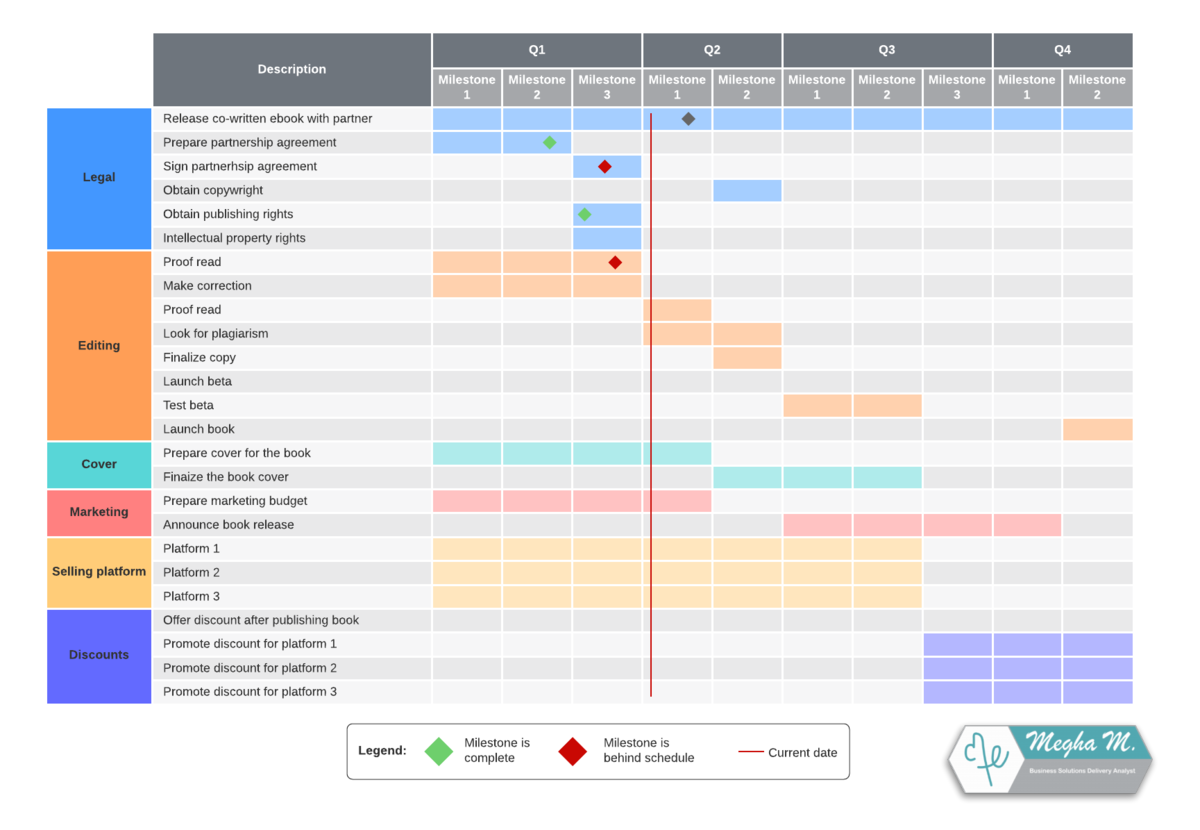
Gantt chart timeline: The Gantt chart timeline is a horizontal bar chart used to visually track the progress of a project over time. It’s ideal for managing projects of any size, as well as coordinating tasks, task duration, dates, and resources.
Dynamic timeline: Dynamic timelines allow the user to move through and manipulate dates in real time. They’re best when visualizing and analyzing large amounts of data, possibly over a large span of time.
Static timeline: Both chronological timelines and vertical bar chart timelines are examples of static timelines. All of the data is presented all at once on a static plane, and the information does not change or move.
Vertical bar chart timeline: A vertical bar chart timeline can be used to track time against amounts, such as money or company growth. Their upward motion provides a quick visualization of gains and/or losses, making them ideal for business analysts or financial teams.
Components of a timeline
Timelines are made up of four basic components:
Dates
: Mark when a specific event takes place on a timelineDescriptions
: Describe a given eventHeaders
(optional): Provide additional context to a timeline when added alongside a descriptionImages
(optional): Add visual interest and additional information
In addition to these four elements, timelines include the following images and symbols:
|
Symbol Image |
Symbol Name |
Description |

|
Line bar |
Used to depict an event, progress, or story from beginning to end. |
|
|
Milestone |
Used to represent events or milestones. Often shows a date. |

|
Time bar |
Used to represent a specific length of time. |

|
Interval |
Used to represent the time that elapses within the timeline sequence. |
Diagramming is quick and easy with Lucidchart. Start a free trial today to start creating and collaborating.
Make a diagramBenefits of using a timeline
Timelines are popular and versatile learning, teaching, and managing tools, and they offer a wide range of benefits. Not only do they provide a clear and organized means of recording and tracking data and events over time, but they also help users to quickly and easily comprehend and retain a wide range of information.
Here’s how timelines can benefit you in the following areas:
Timelines for history: The timeline’s simple structure and ability to depict events and change over time make them particularly useful when studying history. With a timeline, students can effectively visualize the individual events that make up conflicts, social movements, biographies, and other historical occurrences. The visual nature of timelines also makes them useful study tools that can aid in memorization and learning.
Timelines for reading comprehension: Reading comprehension involves an understanding of character development, cause and effect, significance, and the basic beginning-middle-end story structure. Educators can use timelines to clearly outline these components and help students easily identify patterns and significant events within a story. Visual learners in particular can benefit from seeing a story laid out chronologically.
Timelines for project management: Visuals can play a crucial role in keeping your team aligned on project goals and progress. Timelines provide your team with a visual record of what milestones need to be achieved, what’s involved in achieving milestones, and who’s been assigned tasks. They also act as a centralized time schedule, complete with stages and progress updates that keep your team on the same page throughout your project.
How to make a timeline
Take the following steps to create a standard horizontal timeline from start to finish.
- Collect all of the necessary information related to your event, including dates, names, descriptions, tasks, deadlines, etc.
- Using your timeline software, draw out a horizontal line to represent your project, event, or historical occurrence.
- Identify the intervals by which your timeline will be broken up, whether it’s by hours, weeks, or years. If you’re using Lucidchart, turn on the grid to achieve even spacing throughout your diagram.
- Time blocking: Time blocking can be used instead of intervals when scheduling a sequence of tasks or appointments. Insert different colored boxes onto your canvas to represent your tasks, appointments, or milestones in sequential order.
- Add an identifying shape, line, or icon on the left-most side of your timeline to represent your first milestone.
- Add a textbox with all of the necessary details related to your milestone. This can include task information, deadlines, historical information, dates, etc. Keep your description as brief as possible.
- Repeat until your timeline includes all of the necessary milestones or tasks.
- Add any visuals or icons that might contextualize your milestones or aid in visual comprehension.
Check out our additional Lucidchart blogs for specific instructions about how to create a timeline in:
Timeline examples
Take a look at the following timeline template examples to see how you can customize and implement a timeline for yourself.
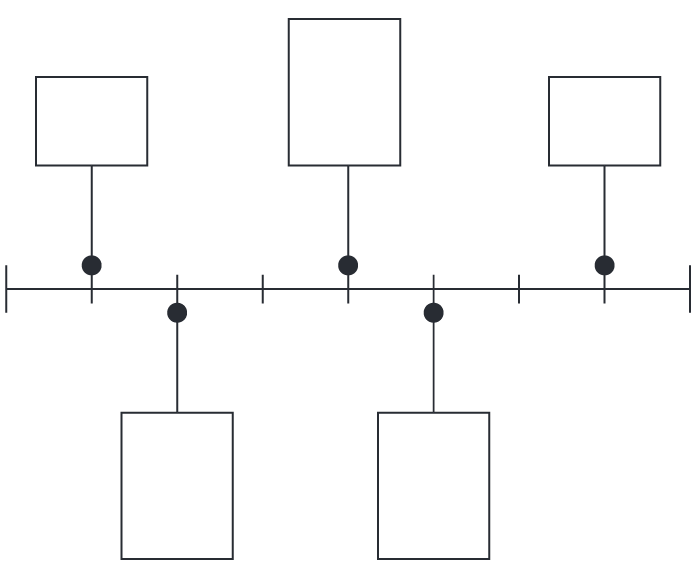
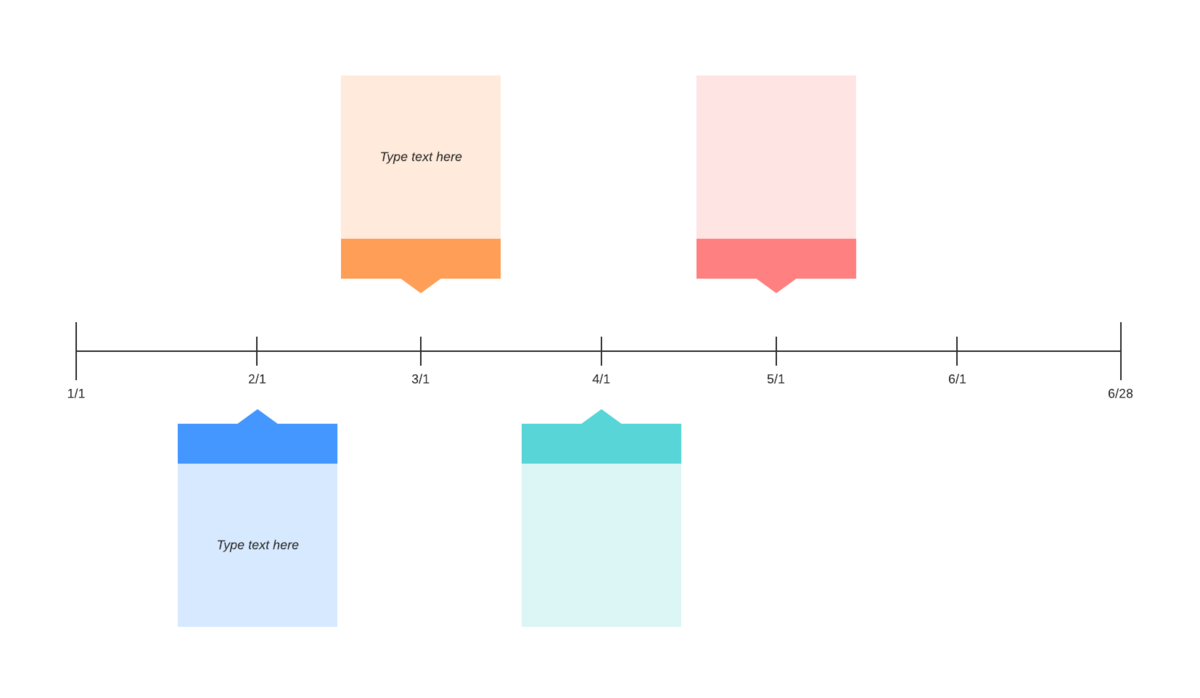
Timeline template:
This very simple layout is ideal for depicting important milestones in chronological order, labeled by month.
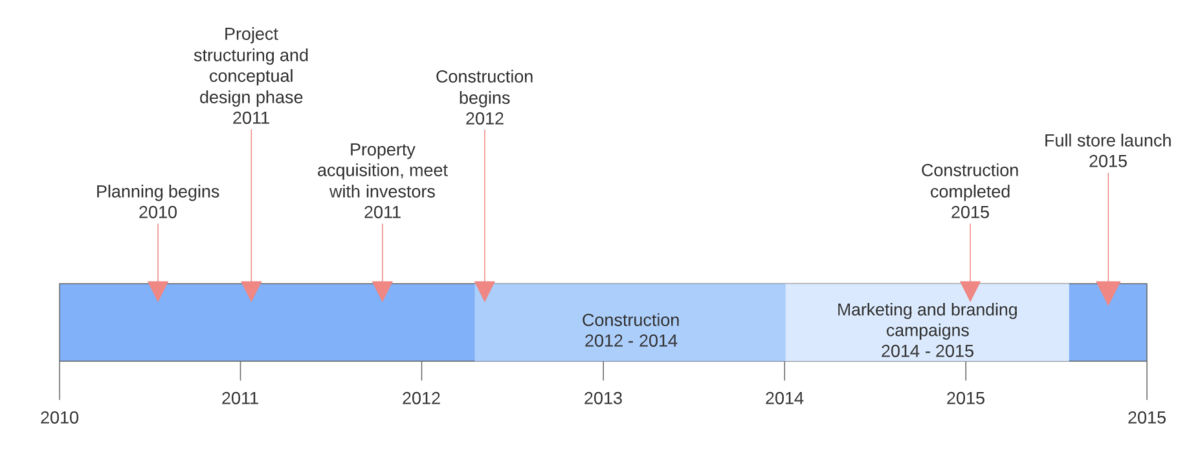
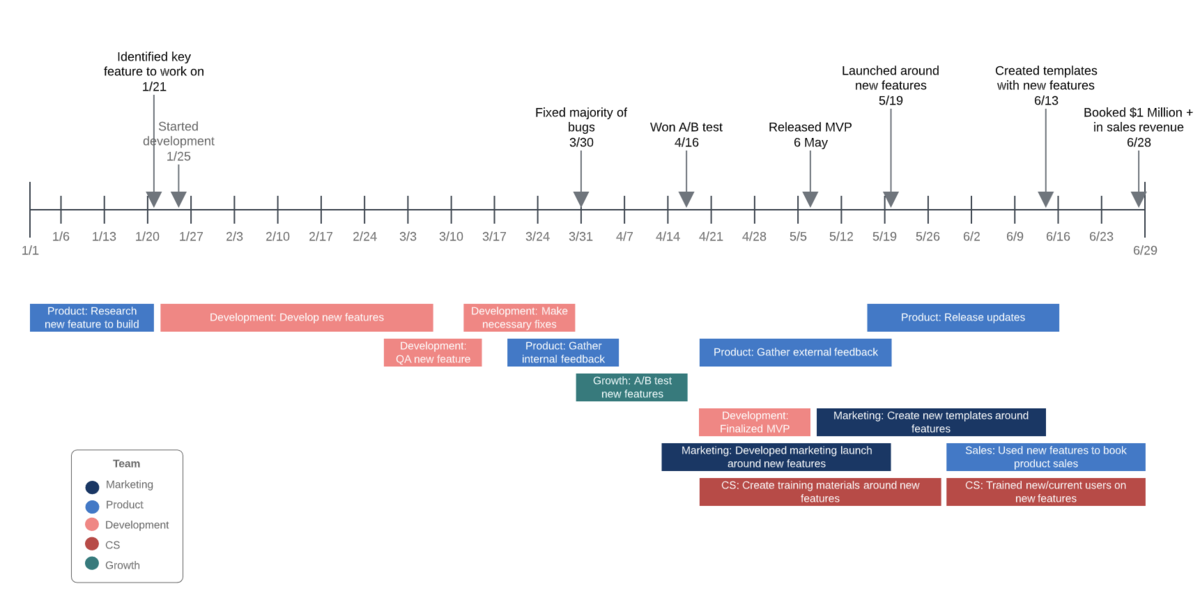
Timeline template with project milestone tracking:
This timeline template can help you show your project’s current progress while identifying project milestones and keeping stakeholders informed.
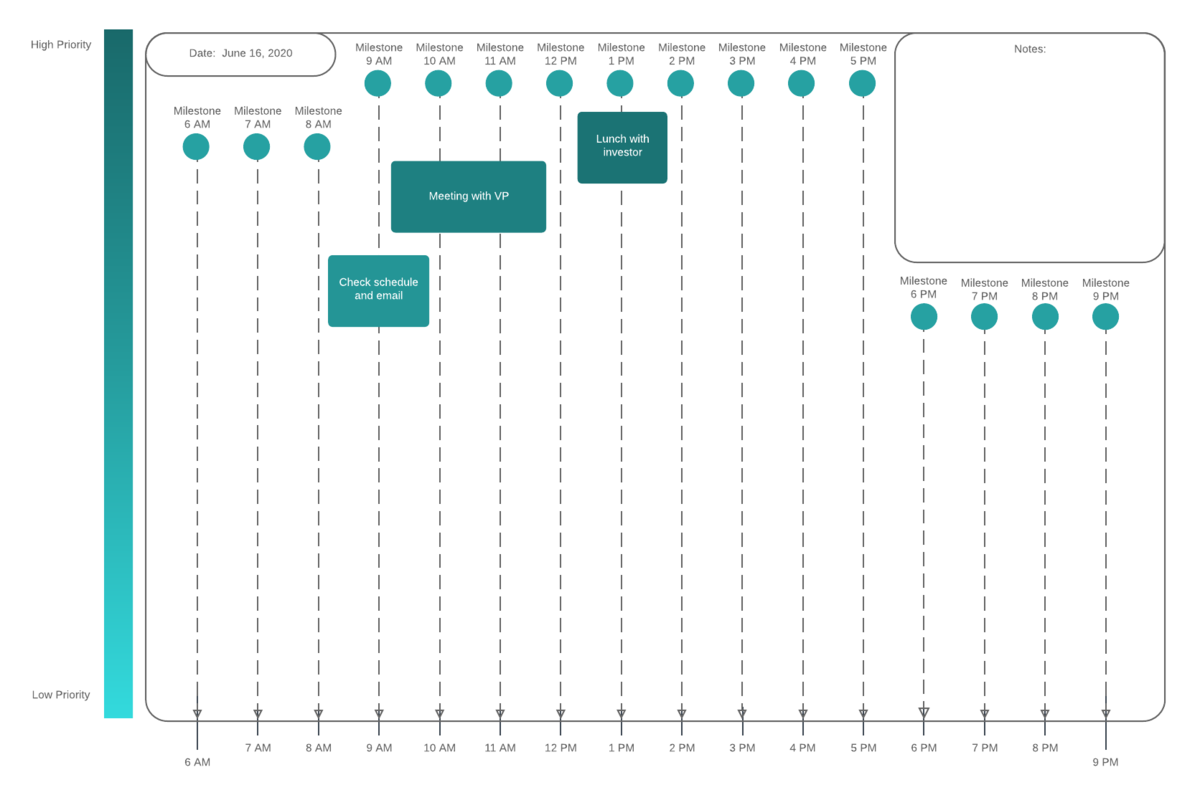
Timeline template of a daily schedule:
This daily schedule timeline template is ideal for visualizing all of the events in a daily schedule, spaced out by hour. This template also includes elements for adding notes and prioritizing individual events, meetings, and activities.