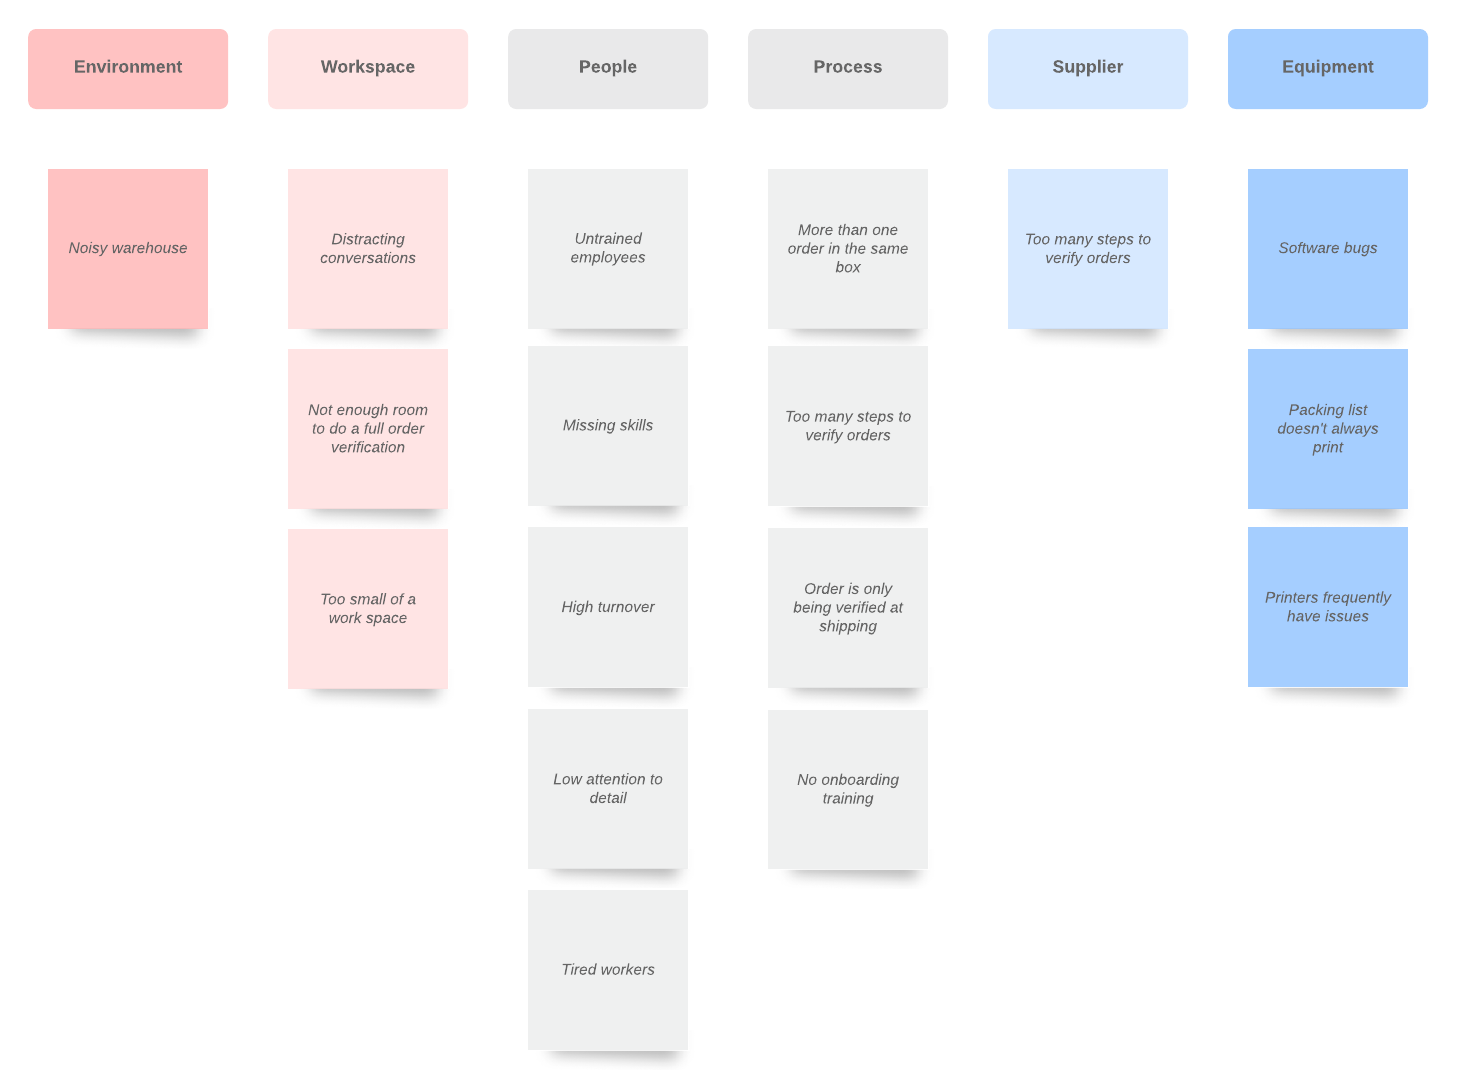
lean tools for process improvement

The Best Lean Tools for Process Improvement

Lucid Content

Reading time: about 7 min

Topics:

  • Process improvement

So you’ve chosen Lean manufacturing as your process improvement methodology. But knowing about Lean manufacturing and knowing how to implement it are two very different things. 

We’re here to help: This article will guide you through implementation with the top Lean manufacturing tools you’ll need to get going. (Side note: These tools will also be applicable for Lean Six Sigma.) 

Implement these tools and stay focused on the real customer-driven benefits of Lean manufacturing—that way, you’ll keep going, even though the Lean production may seem difficult at the beginning, and develop processes that continuously improve over time.

What is Lean manufacturing?

In the simplest terms, Lean manufacturing focuses on constantly improving customer value while minimizing waste. Instead of encouraging management to think of maximizing separate verticals, Lean optimizes the flow of production through value streams that touch every technology, asset, and department.

As you can imagine, changing the mindset of an entire company takes time, so implementing the Lean process may be a slow shift. But trust us: It’s worth it. 

5 main Lean management principles

There are five principles that are the guiding stars of the Lean management process. Each tool you implement will be bolstering the implementation of these principles.

  1. Identify value: Value includes everything that benefits the customer. You’ll need to distinguish value-adding benefits from wasteful processes.
  2. Map the value stream: Once you know what value the product brings to your customer, you’ll need to track its path through production to consumer.
  3. Create flow: A smooth flow has eliminated bottlenecks and waste from production processes.
  4. Establish pull: When your team has time and bandwidth, new work can be started. In a pull system, a task is only begun when there is capacity for the task to be completed.
  5. Continuously improve: Your customer’s perception of value will change over time, so your process must be constantly evolving to generate more and more value.

Keep reading for valuable tools that will improve your process and help easily implement Lean production methods.

Best Lean manufacturing tools by task

There are a ton of process improvement tools you should consider when you start using Lean manufacturing, so we’ve broken them up into each stage of the Lean process. When you find a tool that fits your needs, where applicable, click the corresponding template to start editing and collaborating in real time within Lucidchart.

Note: A few of these tools originated with other process methodologies but can be applied to help your company execute the Lean manufacturing process.

To define and prioritize

In order to identify value, you’ll need to analyze your value stream and find where waste is located. You’ll also need to establish how value travels on its path to the customer so you can make that path more efficient. Use these Lean tools to help:

Affinity diagram

Great for the initial stages of Lean implementation, affinity diagrams are used to sort large amounts of data or ideas. In this context, they can help you identify customer value and gather problems with current processes.

affinity diagram example
Affinity Diagram Example (Click on image to modify online)

Failure mode and effects (FMEA) analysis

To eliminate waste as part of Lean manufacturing, you need to understand what could go wrong in your processes. FMEA analysis allows you to review your flow and anticipate and address issues before they become severe.

FMEA flowchart example
FMEA Flowchart Example (Click on image to modify online)

Value stream analysis

A value stream is the “...entire collection of activities necessary to produce and deliver a product or service.” Once you understand how your value is ultimately delivered to the customer, you can work on perfecting the process of delivery. Create a value stream map to analyze where you can cut non-value added activities.

Process flowcharts 

The easiest way to create and maximize flow is to visualize it. Process flowcharts can help you track flow in an easy-to-understand way.

business process flow template
Business Process Flow Template (Click on image to modify online)

To analyze root causes

If a key goal of Lean manufacturing is to remove waste from your workflows, you’ll need to first identify the root cause of that waste. Get started with these two tools:

5 Why analysis

To understand issues in the process, you may need to implement a 5 Why analysis, a process where you keep asking “Why?” until you eventually reach the root cause. This template will help you and your team think critically to identify solutions to even the largest problems.

alt text
5 Whys Example (Click on image to modify online)

Fishbone diagram

Also known as a cause-and-effect diagram or Ishikawa diagram, the fishbone diagram can help you effectively eliminate issues by examining a problem from multiple angles. In a typical fishbone diagram, you would consider these categories of potential causes: measurements, materials, people, machines, methods, and environment. But you can adapt this diagram to fit your organization.

fishbone diagram example
Fishbone Diagram Example (Click on image to modify online)

To implement improvements

Once you understand your process and have identified issues that are causing waste, it’s time to implement improvements. But implementation can often be the most difficult part of the Lean or Lean Six Sigma process. Use these diagrams to help:

5S dashboard

Often used in manufacturing, the 5S approach will help you organize your workspace for maximum efficiency. Based on five Japanese terms, the 5 S’s translate to: 

  • Sort (remove unnecessary items from the location)
  • Set in order (put items in the best place for their function)
  • Shine (clean and inspect the workspace regularly)
  • Standardize (create repeatable processes to implement the first three practices)
  • Sustain (train workers and perform audits to ensure processes are followed)

Some organizations have added a sixth practice—safety—to identify hazards and set controls to ensure workers are safe. A dashboard can help you track how employees are performing in each of these areas.

6S summary dashboard example
6S Summary Dashboard Example (Click on image to modify online)

Error-proofing

Create a flow that is designed to be fail-proof. Commonly known by the Japanese term poka-yoke, this tool involves implementing mechanisms that keep your company from producing products with defects, thereby avoiding waste. There are three main types of error-proofing: warnings (think of a fire alarm), shutdown controls, and autocorrection controls.

A3 report

An A3 report includes the most essential information about your processes to present progress, eliminate waste, problem-solve, and make better decisions.

A3 report example
A3 Report Example (Click to use as a Lucidchart template)

Total Productive Maintenance (TPM) 

The TPM method gets machine operators involved with regular preventative maintenance to ensure equipment reliability, increase productivity, increase capacity, and improve quality.

Plan Do Check Act (PDCA) cycle

The PDCA cycle is a key element of Lean management—this tool helps companies transition to continuous improvement. Professionals using this repeatable method will analyze a problem or an opportunity to change, test a hypothesis, review and analyze the results, and implement the plan if successful. 

plan-do-check-act example
Plan-Do-Check-Act Example (Click on image to modify online)

Value stream map

A value stream map visualizes the steps involved with delivering a product or service. Within your value stream map, you’ll track important data to see where waste exists and whether you’re delivering the quality your customers expect. This data can include takt time, or the maximum amount of time you can spend to satisfy customer demand.

alt text
Value Stream Mapping Example (Click on image to modify online)

Control the process

Arguably the most beneficial aspect of the Lean manufacturing process is its focus on continuous improvement. This mindset allows organizations to evolve along with customer needs and to continuously adapt to the changing world. Apply these diagrams to control processes and focus on improvement.

Cellular manufacturing

Also included within just-in-time manufacturing, cellular manufacturing eliminates waste using an assembly line method. A product moves from one “cell,” or a machine that accomplishes a specific task, to another cell.

Kanban

Although many think of Kanban boards for project management, Kanban can also be a means to control production: which items are produced, how many, and when. With the Kanban method, a pull queue can be set up ahead of time, and tasks can be “pulled” from the list as needed.

Kanban board template
Basic Kanban Board With Prioritization (Click on image to modify online)

Control plan

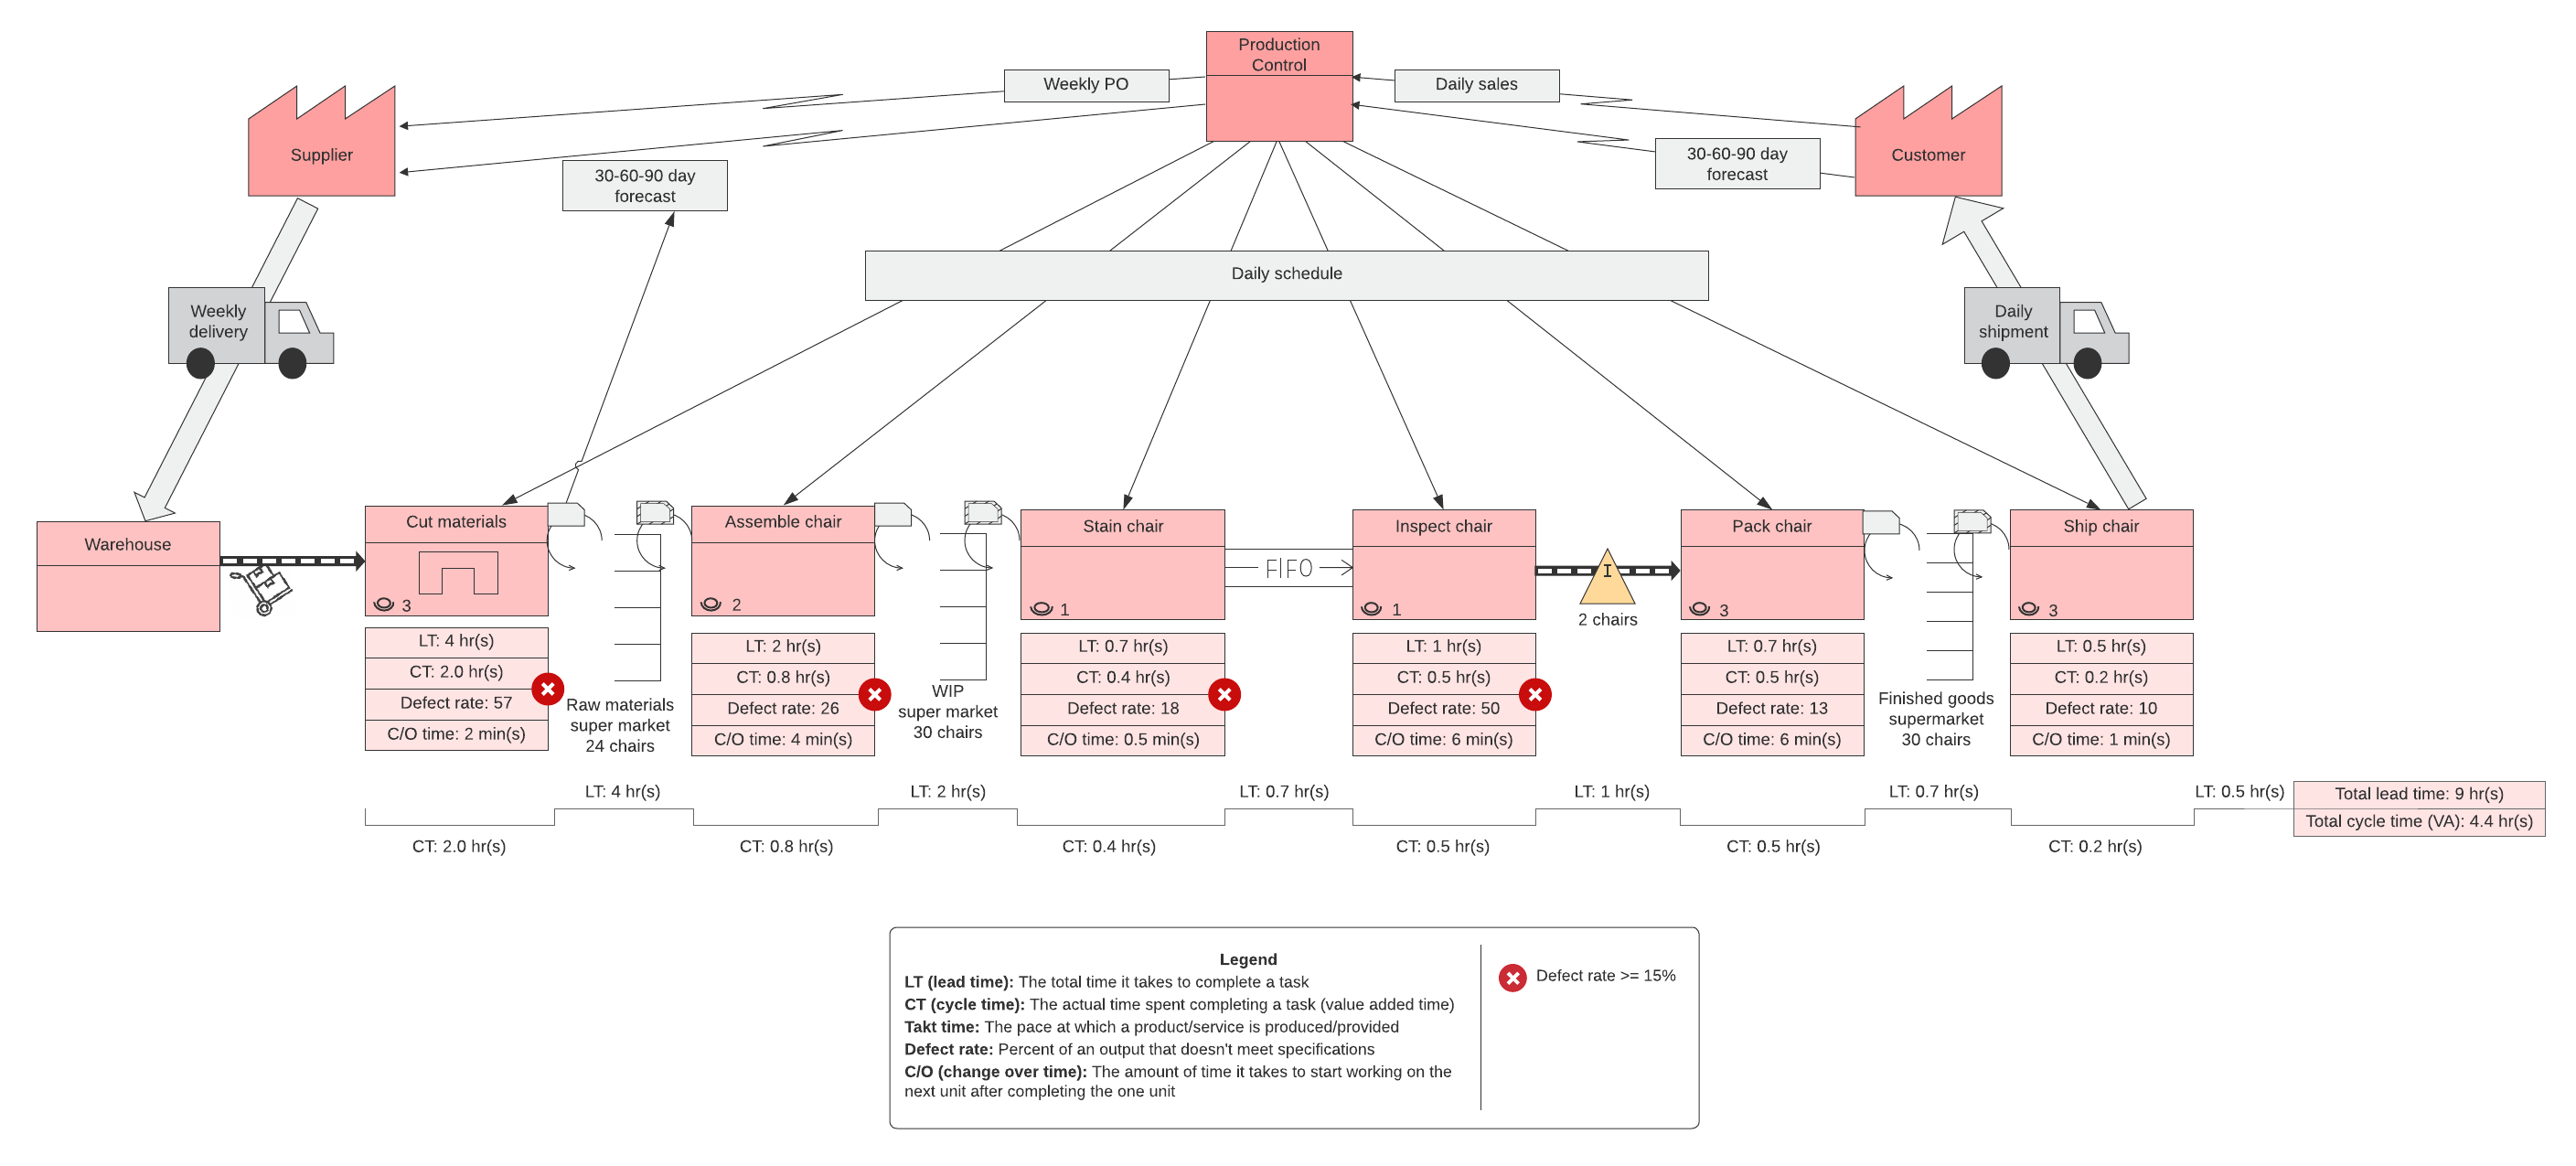
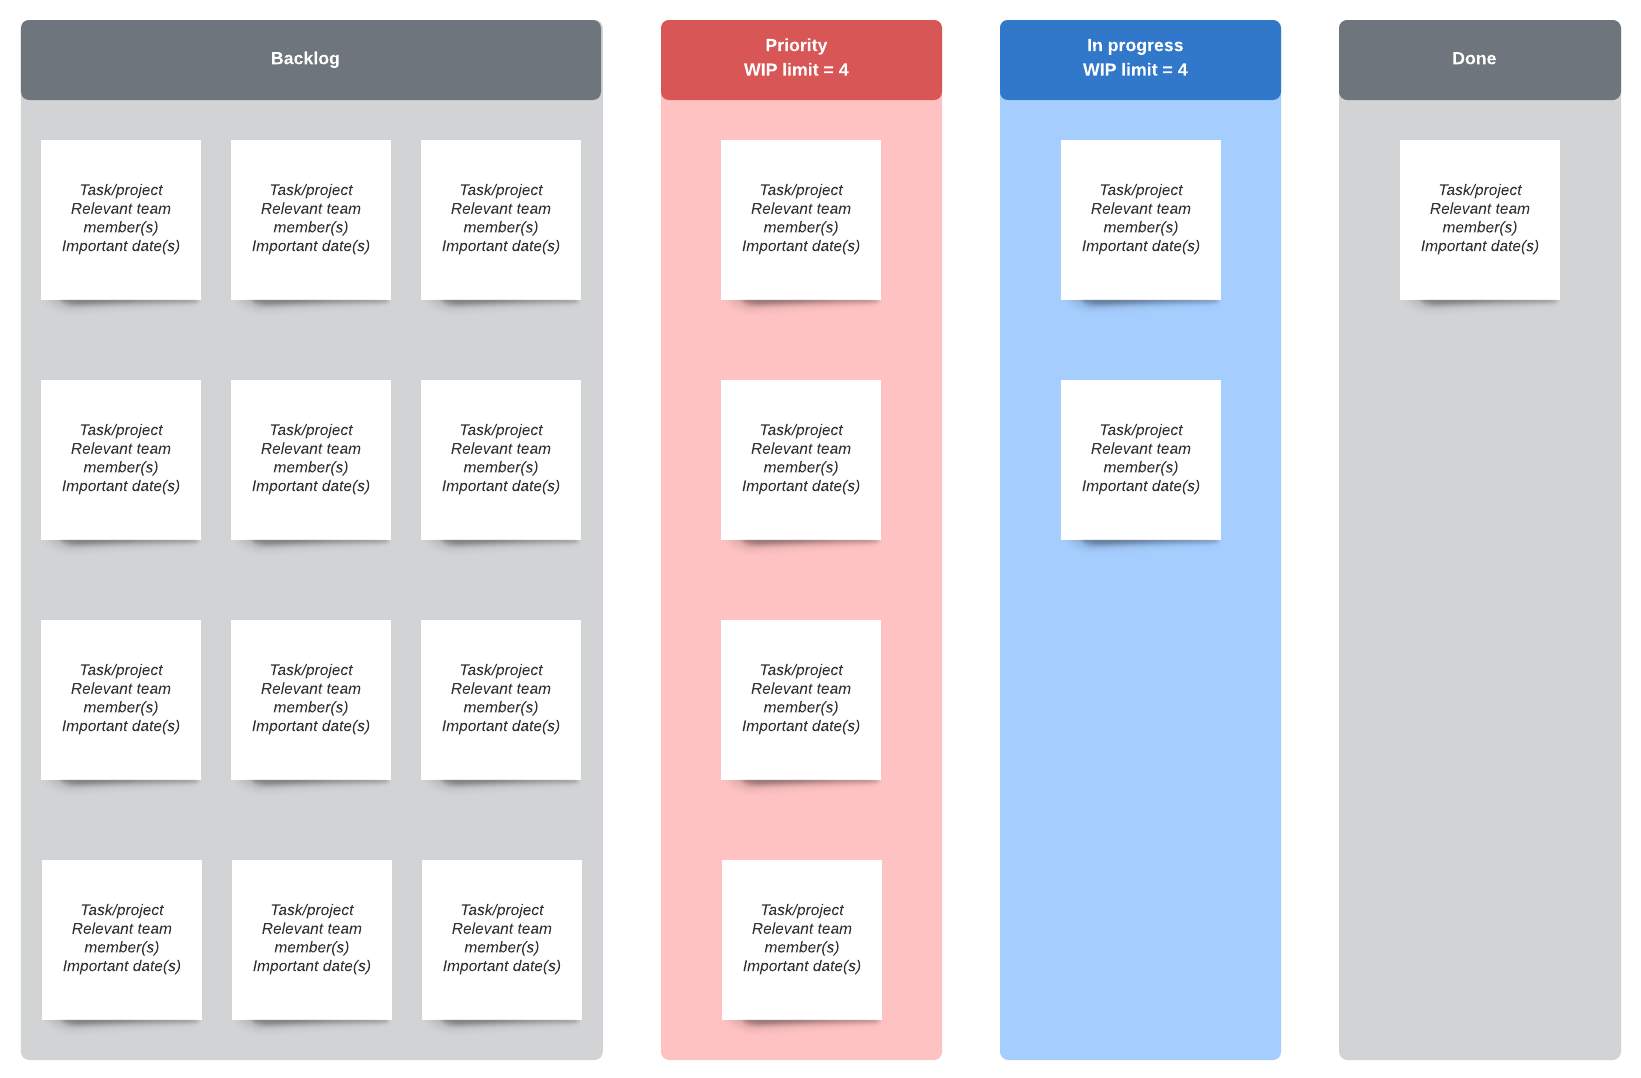
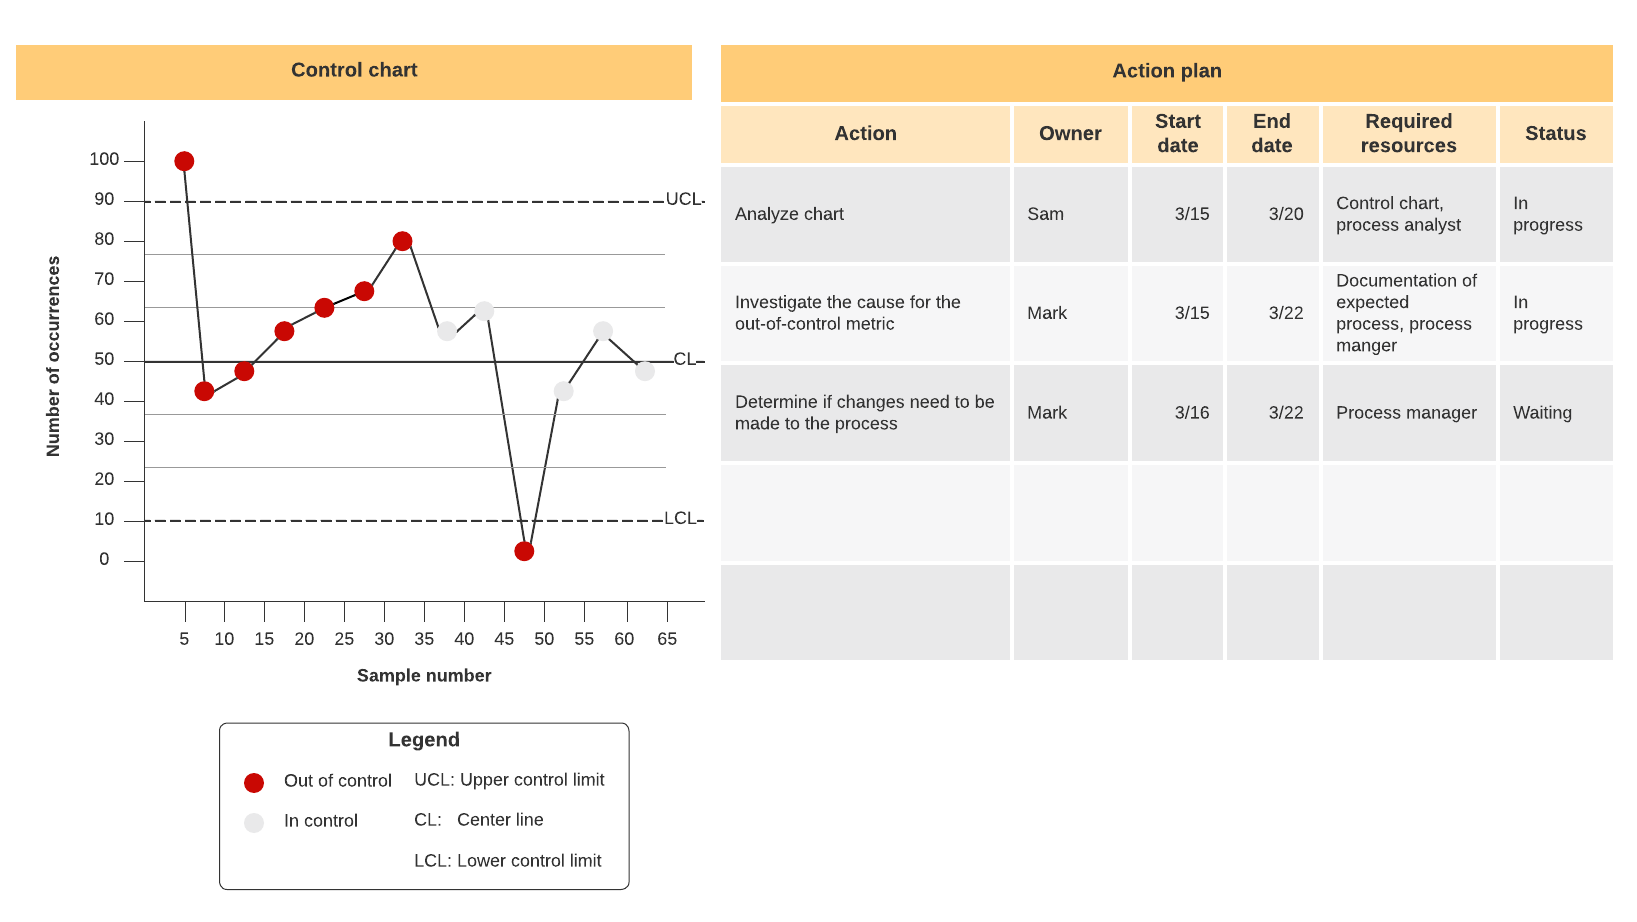
This tool will help you track each step of your process and take corrective actions for continuous improvement.

control chart example
Control Chart Example (Click on image to modify online)

Developing your strategy

Each organization is different, so you may need to experiment to discover the templates and diagrams most appropriate for your company. You’ll find, however, that even the most basic tools can really hone in your organization’s ability to eliminate waste and focus on continuous improvement. 

It may seem like too great a task for a flowchart or diagram, but you’ll be surprised at the impact these seemingly small tools have on your implementation of Lean manufacturing techniques. 

See how Lucidchart can help anyone see, improve, and scale business processes.

Learn more

Lucidchart

Lucidchart, a cloud-based intelligent diagramming application, is a core component of Lucid Software's Visual Collaboration Suite. This intuitive, cloud-based solution empowers teams to collaborate in real-time to build flowcharts, mockups, UML diagrams, customer journey maps, and more. Lucidchart propels teams forward to build the future faster. Lucid is proud to serve top businesses around the world, including customers such as Google, GE, and NBC Universal, and 99% of the Fortune 500. Lucid partners with industry leaders, including Google, Atlassian, and Microsoft. Since its founding, Lucid has received numerous awards for its products, business, and workplace culture. For more information, visit lucidchart.com.

Bring your bright ideas to life.

Sign up free

or continue with

Sign in with GoogleSign inSign in with MicrosoftSign inSign in with SlackSign in

Get started

  • Pricing
  • Individual
  • Team
  • Enterprise
  • Contact sales
PrivacyLegal

© 2024 Lucid Software Inc.