Using network diagrams for diagnosis and troubleshooting
Lucid Content
Reading time: about 6 min
Topics:
We rely so heavily on technology today that any network problem can halt productivity and cost your company if the issue isn’t dealt with quickly. Prevent losses and eliminate frustration with a comprehensive network diagram of your space. You’ll be able to pinpoint the issue with one glance at Lucidchart and take off to resolve it.
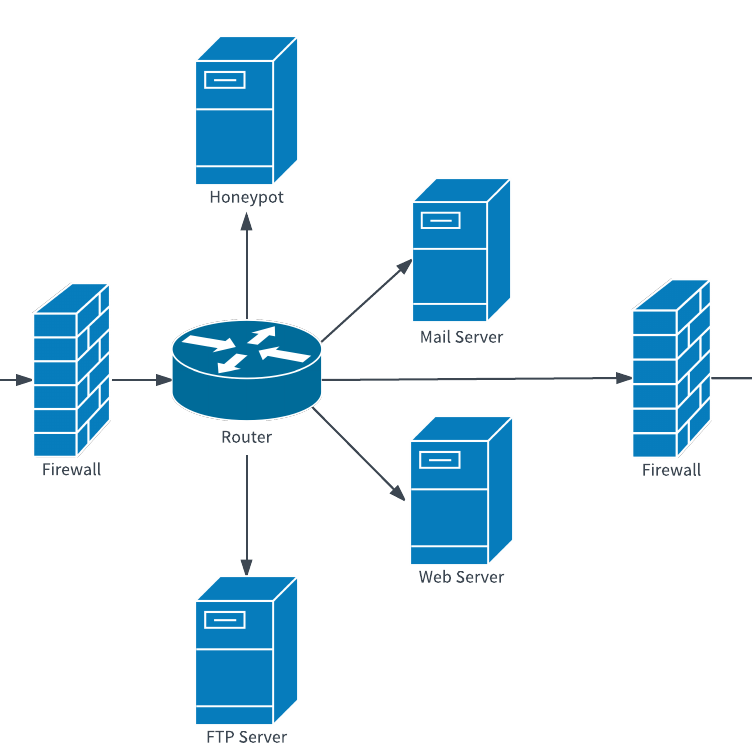
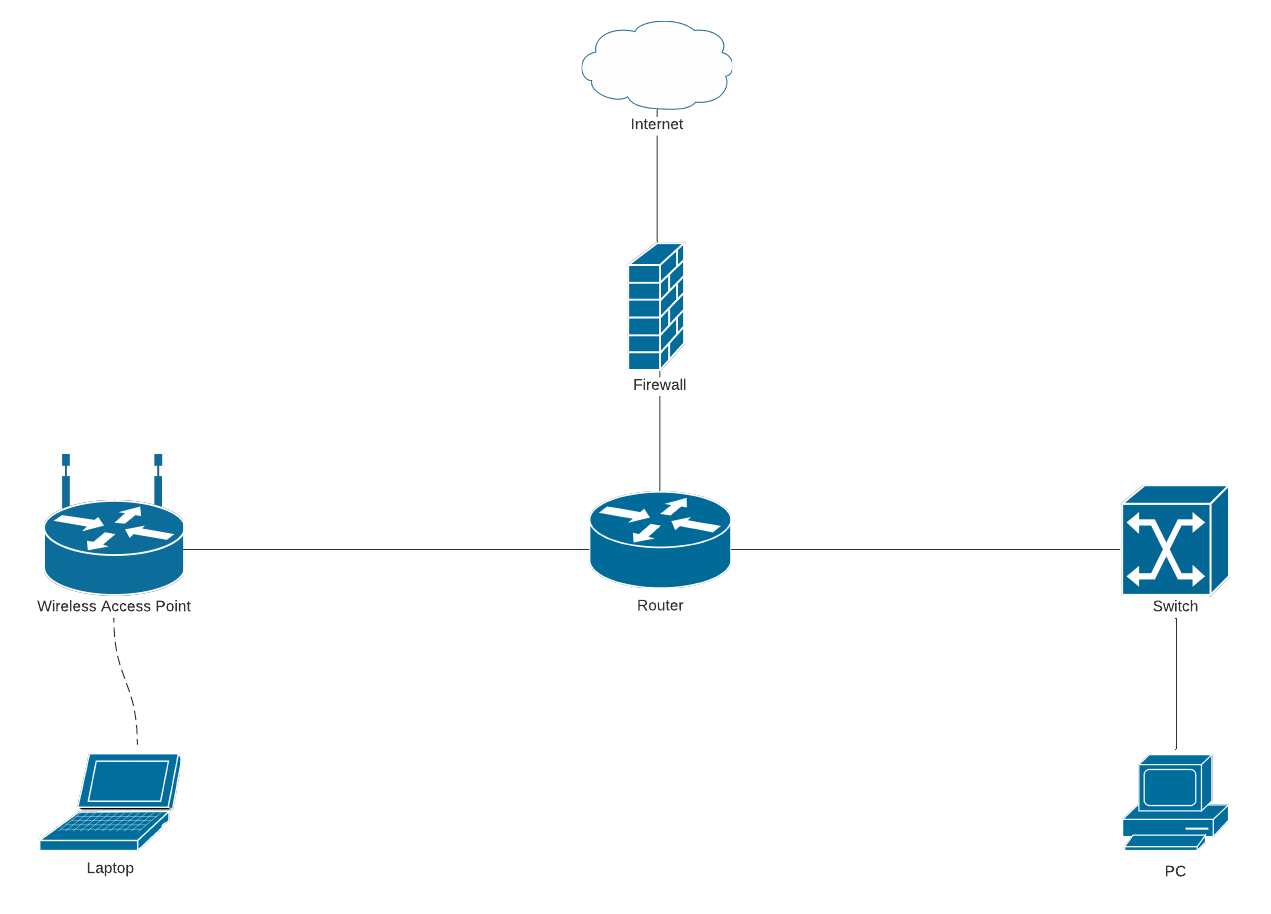
Network diagrams display the components of a computer or telecommunications network, including routers, firewalls, and devices, and show how those components interact. They vary greatly depending on the type of network, but you will likely want two diagrams, a logical network diagram and a physical network diagram.
Benefits of a logical network diagram
First, illustrate how information flows through your network with a logical network diagram. These diagrams could describe:
- Wide area networks (WAN)
- Local area networks (LAN)
- Virtual private networks
- DSL network connectivity
- AWS network architecture
You can make this network diagram as detailed as you want—it could include just a broad overview or consolidate all of your information, such as IP addresses, in one spot.
Benefits of a physical network diagram
When you experience network issues with your office or data center, we’re not always talking about a breakdown somewhere in the recesses of the Internet. We’re often talking about physical objects that are no longer functioning as they should. Network engineers need a visual presentation of this space to understand where the source of the problem may lie.
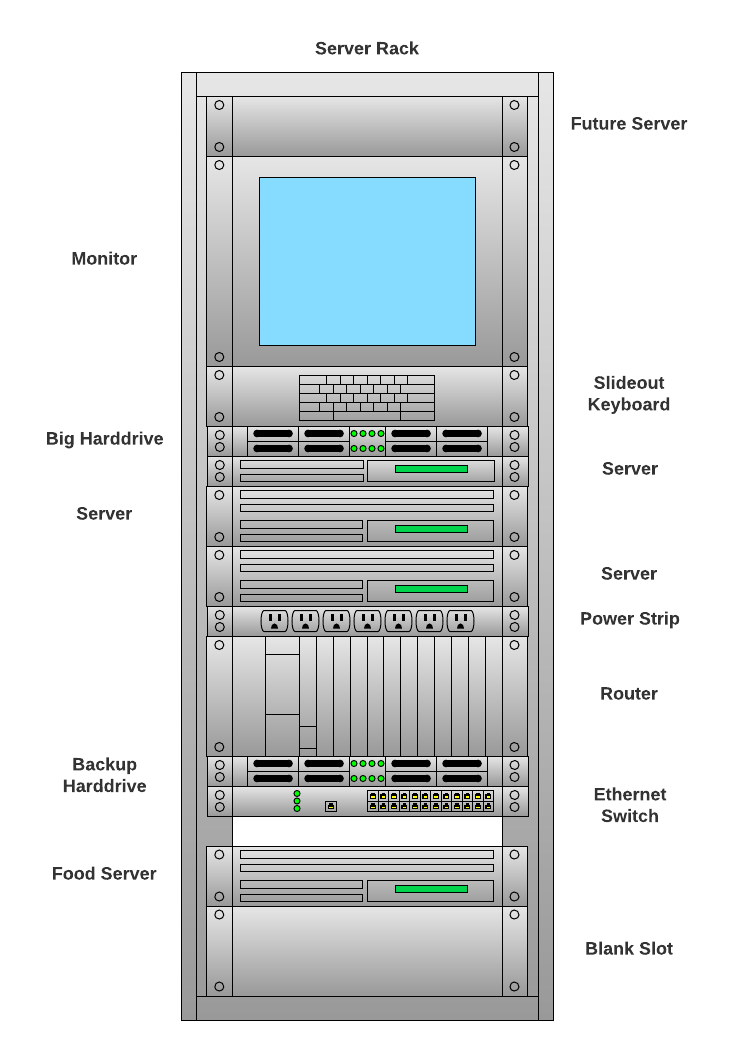
Within Lucidchart, you can create a physical network diagram to solve this type of issue. An effective network diagram could display:
- Wi-Fi access points and their corresponding channels/frequencies
- Wi-Fi coverage mapping to avoid cross-talk between domains
- The location of phones, computers, printers, and other devices
- A layout of the server rack
- Labeled ports to show where computers and other devices connect to the server
The more information you provide within the diagram, the better prepared you will be to solve network issues during network troubleshooting.
Other benefits of network diagrams
Aside from offering a simple visual for pinpointing possible issues, network diagrams provide many other benefits for your company. Using network diagrams can help with:
Planning network updates
Anytime you need to make a change, refer back to your network diagram. For example, do you need to add more devices to your network? Figure out where you have port space available, how this device will connect to the Internet, etc.
Keeping track of PCI compliance
If you collect credit card information from customers, make sure you have the proper firewalls and access control measures in place and have followed the requirements for physical security. Learn more about how you can make network diagrams that help you prove and maintain compliance by meeting criteria outlined in PCI compliance standards.
Creating network documentation
Creating network diagrams are an essential piece of documentation that every department should have. Hosting your network documentation in a central location like Lucidchart ensures teams have access the current state of your network as they address network problems during network troubleshooting, as your department responds to audits, during security reviews, and more.
Onboarding
Everyone should be on the same page as far as how the network functions and how all the elements connect. Bring new IT engineers up to speed quickly with thorough documentation in Lucidchart, and in the apps you already frequently use, such as Confluence, Jira, Microsoft, Google, Slack, and more.
Provide remote assistance for other offices
You may not always have IT teams located in every office. When a branch of your business experiences network problems, IT teams can leverage your up-to-date network diagrams to provide remote assistance, quickly resolving the network issue from afar. You can even use a floor plan to map out where all your physical equipment is located so it can be easily found it in the case of an issue, ultimately helping incident response teams understand how the office is set up, without needing to be there, all while following compliance regulations.

Read how LogMeIn uses Lucidchart to offer remote connectivity support from anywhere.
Read case studyLucidchart solutions for network diagramming
As we’ve hinted, Lucidchart is a dynamic options as you look for logical and physical network diagramming solutions. The following features within Lucidchart will strengthen your network diagrams so you have enough information at your disposal to diagnose and troubleshoot errors.
Network diagram templates and industry-standard symbols
Lucidchart offers templates for generic network and server rack diagrams. If none of the templates match the framework of your office or data center, Lucidchart still has all the shapes you need so you don’t have to completely start from scratch. Open our shape libraries for clean, simple symbols to represent your computers, servers, firewalls, etc.
If you are building a physical network diagram, we also have floor plan templates for recreating your office space.
Features to customize the view of your network diagram
Use Layers and shape Actions to make your diagram’s elements easier to see and find.
- Layers: If you add too much information into a single, tight spot of your diagram, it can become less effective and hard to understand. With Layers in Lucidchart, you can separate different types of information, such as Wi-Fi coverage mapping or additional details about each port. Just toggle the layers and find the exact information you need. You can also create and toggle between current and future state versions of your network diagram when you're hoping to make changes.
- Shape Actions: If your network diagram involves multiple pages, you can use hotspots to show the user where to look next. Shape Actions in Lucidchart allow you to link to other pages within the document, hyperlink to external resources (perhaps to Confluence pages or Jira tickets), and even show, hide, or toggle layers.

Real-time collaboration and sharing features
Your ability to diagnose and troubleshoot issues later on depends on the accuracy of your network diagram now. Confirm that you have complete, correct information with these collaborative features:
- Real-time editing with multiple users
- Chat and comments
- @mention notifications
- Support for all operating systems and devices
As your company grows and as you add to your network, you can make changes to your diagram in Lucidchart for all collaborators to see. Any changes you make will be reflected in the apps where you've already added your network diagrams. For example, changes will be made to Confluence wiki pages where you've embedded diagrams, or in Jira issue tickets as you create and resolve incidents.
Using Lucidchart as your go to network troubleshooting tool allows you to access the information you need in one central location, while keeping team members up to date as you work through network problems together over Slack, Microsoft Teams, and the other apps you're already using. Simply include your Lucidchart network diagrams where you're already working, like Atlassian, so your IT teams have the information they need, when they need it.

Try it free today
Start your network diagrams or switch over your existing diagrams to Lucidchart.
Learn howAbout Lucidchart
Lucidchart, a cloud-based intelligent diagramming application, is a core component of Lucid Software's Visual Collaboration Suite. This intuitive, cloud-based solution empowers teams to collaborate in real-time to build flowcharts, mockups, UML diagrams, customer journey maps, and more. Lucidchart propels teams forward to build the future faster. Lucid is proud to serve top businesses around the world, including customers such as Google, GE, and NBC Universal, and 99% of the Fortune 500. Lucid partners with industry leaders, including Google, Atlassian, and Microsoft. Since its founding, Lucid has received numerous awards for its products, business, and workplace culture. For more information, visit lucidchart.com.
Related articles
How to become a network infrastructure mapping expert
Many organizations are changing and improving their network infrastructure, and visualizing your network infrastructure can help you better identify weaknesses and places for refinement. Learn how to start network infrastructure mapping and see how Lucidchart can help.
Network diagram templates and examples
Let Lucidchart take the complexity out of building network diagrams. Save time and use one of our network diagram templates to help you get started today!
Bring your bright ideas to life.
By registering, you agree to our Terms of Service and you acknowledge that you have read and understand our Privacy Policy.

